13 min chart and the Golden Mean Number
An introduction from Bruce.
I have been plotting the 13 min chart and placing +/- 161.8, 100.0, 127.2 and 50 on the charts and I observed the interesting relations of the first 13 min bar.
The first 13 min bar will be painted and the fibs placed on it. Bruce only places the x61.8 numbers, I have added 127.2 and 100.0 numbers as a study.
Bruce paints them in 1 direction, up. Well I paint them according to the bar direction. But I think it works the same just the numbers may be inversed.
This only works on RTH somewhat. I tried Globex. Doesn't give the same thing. The 15 min is close but not as close as the 13min. I think Bruce calls this the initial impulse 13 min. Why 13, I don't know, I think his references are at http://www.goldennumber.com
50%, 161.8% and 261.8% are magnets, resistance and support.
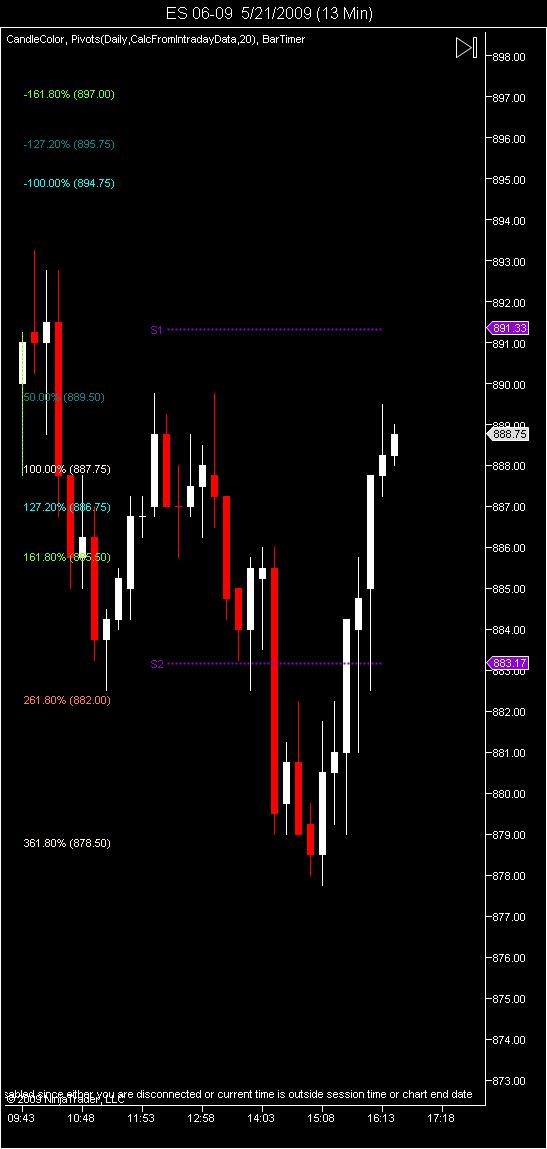
This was yesterday's action 5/21
It was weak and went straight for the 161.8%, it did not offer much support. it did bounce in the next 13 min bar. Notice the 100% is acting as resistance.
It went straight to 261.8%. I think the low of that bar is 82.75. It bounced and notice that 50% of the initial 13 min is resistance for 3 times.
127.2% tried as a support to go bullish but it failed as crumbled on the repeated attacks of the bears.
Lastly 361.8% offered support as it was close to the 877 number that Larry P. and most have predicted as good support. The low was 877.75.
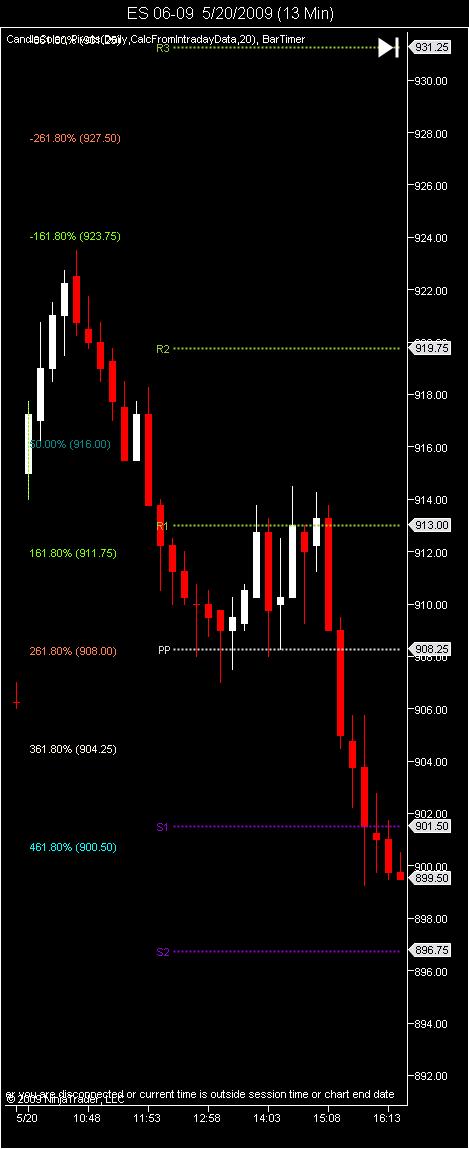
You can observe the rest of the charts. It does not always work and it does not slam into the number and bounces. It is only an indication. Where the resistance and support during RTH is.
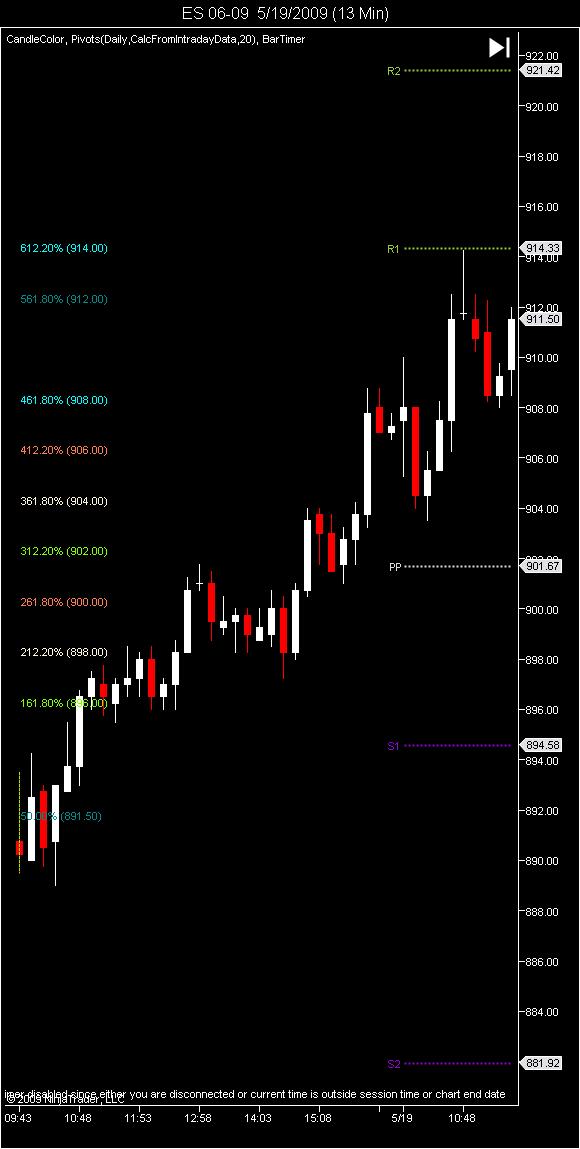
Here another number I noticed since 50% is a magnet, I expanded the in betweens of the Golden Mean Numbers and a pattern is formed.
I have been plotting the 13 min chart and placing +/- 161.8, 100.0, 127.2 and 50 on the charts and I observed the interesting relations of the first 13 min bar.
The first 13 min bar will be painted and the fibs placed on it. Bruce only places the x61.8 numbers, I have added 127.2 and 100.0 numbers as a study.
Bruce paints them in 1 direction, up. Well I paint them according to the bar direction. But I think it works the same just the numbers may be inversed.
This only works on RTH somewhat. I tried Globex. Doesn't give the same thing. The 15 min is close but not as close as the 13min. I think Bruce calls this the initial impulse 13 min. Why 13, I don't know, I think his references are at http://www.goldennumber.com
50%, 161.8% and 261.8% are magnets, resistance and support.
This was yesterday's action 5/21
It was weak and went straight for the 161.8%, it did not offer much support. it did bounce in the next 13 min bar. Notice the 100% is acting as resistance.
It went straight to 261.8%. I think the low of that bar is 82.75. It bounced and notice that 50% of the initial 13 min is resistance for 3 times.
127.2% tried as a support to go bullish but it failed as crumbled on the repeated attacks of the bears.
Lastly 361.8% offered support as it was close to the 877 number that Larry P. and most have predicted as good support. The low was 877.75.
You can observe the rest of the charts. It does not always work and it does not slam into the number and bounces. It is only an indication. Where the resistance and support during RTH is.
Click image for original size
Click image for original size
Here another number I noticed since 50% is a magnet, I expanded the in betweens of the Golden Mean Numbers and a pattern is formed.
Click image for original size
Emini Day Trading /
Daily Notes /
Forecast /
Economic Events /
Search /
Terms and Conditions /
Disclaimer /
Books /
Online Books /
Site Map /
Contact /
Privacy Policy /
Links /
About /
Day Trading Forum /
Investment Calculators /
Pivot Point Calculator /
Market Profile Generator /
Fibonacci Calculator /
Mailing List /
Advertise Here /
Articles /
Financial Terms /
Brokers /
Software /
Holidays /
Stock Split Calendar /
Mortgage Calculator /
Donate
Copyright © 2004-2023, MyPivots. All rights reserved.
Copyright © 2004-2023, MyPivots. All rights reserved.