Monkey ES Daily Chart for Wed
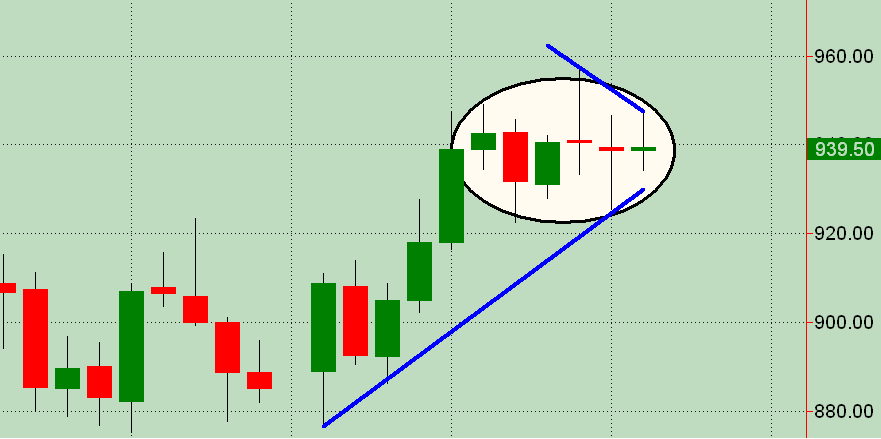
I've drilled down on the ES 24hr Daily chart where there is a tightening of consolidation and narrowing of range. The past 3 days are all Dojis and all opening/closing within a few points of each other. There's a "wedge" look to it as well.
Almost had an inside day today but price poked up just a few ticks above yesterday. Still may have some of the same dynamics, considering the sideways contraction here just beneath some significant resistance in the 960's. Just providing a few observations here and would welcome any feedback and/or other analysis and posted charts.
Almost had an inside day today but price poked up just a few ticks above yesterday. Still may have some of the same dynamics, considering the sideways contraction here just beneath some significant resistance in the 960's. Just providing a few observations here and would welcome any feedback and/or other analysis and posted charts.
Click image for original size
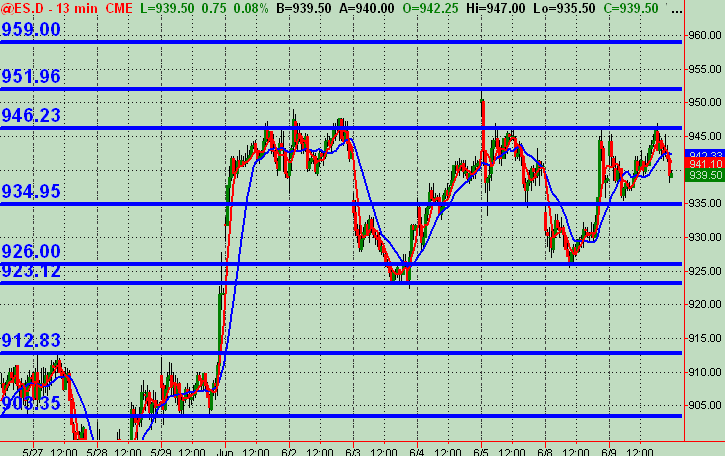
Also, as usual, the 13 minute chart with price action Support/Resistance levels as a "map." Hope some are finding it helpful ... and again, offer your comments and analysis here for prepping, coming into tomorrow's trading session!!
Click image for original size
I'd be remiss if I didn't also include the Bigger Daily Picture that I'm looking at and posted yday (I think?). That daily chart on the 1st page of the below link shows what I was referring to with significant resistance in the 960's ... that Joe also commented on.
http://www.mypivots.com/forum/topic.asp?TOPIC_ID=4502
http://www.mypivots.com/forum/topic.asp?TOPIC_ID=4502
thanks monkey
Emini Day Trading /
Daily Notes /
Forecast /
Economic Events /
Search /
Terms and Conditions /
Disclaimer /
Books /
Online Books /
Site Map /
Contact /
Privacy Policy /
Links /
About /
Day Trading Forum /
Investment Calculators /
Pivot Point Calculator /
Market Profile Generator /
Fibonacci Calculator /
Mailing List /
Advertise Here /
Articles /
Financial Terms /
Brokers /
Software /
Holidays /
Stock Split Calendar /
Mortgage Calculator /
Donate
Copyright © 2004-2023, MyPivots. All rights reserved.
Copyright © 2004-2023, MyPivots. All rights reserved.