ITM vs OTM
Monkey,
I bought 20 SPY 94's @ 1.48 ($2960) and 30 june 95 calls @ .95 ($2960) Lets see which does better. Based on my swing RSI rules. I should have done july since the market is stuck in this rut.
Target is 96.0 on the SPY
I bought 20 SPY 94's @ 1.48 ($2960) and 30 june 95 calls @ .95 ($2960) Lets see which does better. Based on my swing RSI rules. I should have done july since the market is stuck in this rut.
Target is 96.0 on the SPY
quote:
Originally posted by CharterJoe
Monkey,
I bought 20 SPY 94's @ 1.48 ($2960) and 30 june 95 calls @ .95 ($2960) Lets see which does better. Based on my swing RSI rules. I should have done july since the market is stuck in this rut.
Target is 96.0 on the SPY
If the options are out of the money are you entitled to a bail out
Joe,
Cool! We've got the initial experiment going. Did you jot down the price of the SPY (and ES for that matter) at the time your option positions were filled? Also, jot it down when the trades are closed out. Will possibly be good for further analysis and additional insights. Yeah, junes ... and here we sit in a trading range longer than I've seen in a while ... gotta love it, but they'll prob do just fine. With this range, I'd think volatility might kick up pretty good in the OTM's on a percentage basis assuming the SPY moves up at a solid velocity ... FINGERS CROSSED (though I've not looked at the VIX and 96 is the top of the range, so wouldn't be like a "breakout" type of volatility prem spike). Hopefully, we'll get a decent move in a short period of time since time decay is accelerating a bit now on the junes. Then we'll have a nice clean result to look at and find which offered the better percent return on the $2960 put to work. Good stuff Joe!
Oh yeah, a thought just occured to me ... you may already be doing it anyway. It would offer even more to work with by simply pulling up an option chain of real time quotes and last trades etc. and doing a screenshot at time of entry AND at time of exit. I guess this could even be paper traded and could then do calcs. on the different options themselves while also noting the SPY price at time of screen captures. Some "real world" themes might emerge (vs. academic option price modelling).
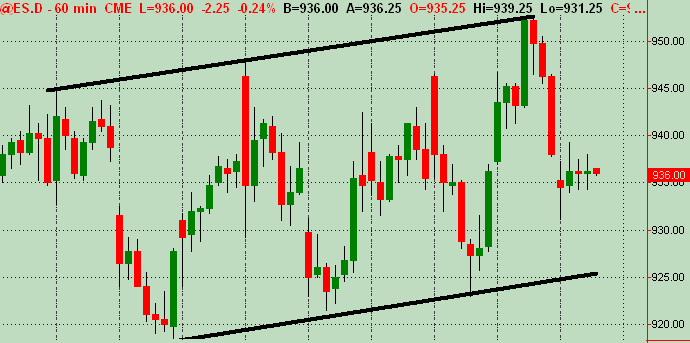
Good lord ... it feels like an August trading day. Btw, here's the ES slightly upward sloping trend channel on a 60min RTH chart. Decent 20-30 point regular swings over the past 8 sessions or so. Don't have this on the SPY ... but already had it drawn on the ES.
Click image for original size
LOL red.
The ES was @ 936.50 at the time of the trade I can't believe I missed that, and SPY was at 94.50.
The 94'2 closed @ 1.70 +$440 on those as of the close.
The 95's closed @ 1.10 +$450 on those as of the close.
So there neck to neck so far....
The ES was @ 936.50 at the time of the trade I can't believe I missed that, and SPY was at 94.50.
The 94'2 closed @ 1.70 +$440 on those as of the close.
The 95's closed @ 1.10 +$450 on those as of the close.
So there neck to neck so far....
Will be interesting to see if we have a good push up on Monday towards SPY 96 considering how dead price movement was today. The option prices should show their colors at that point. Glad ya got some profits working on the experiment :-)
Should have gone with the July's. Any other time I would go with the next month, that was a mistake on my part. But I think that the payout is the same this close together.
Yeah, frustrating. I'm gonna start tracking option chains with a screen shot when entering and exiting a SPY options trade (both real and paper) to get some more trade scenarios and more data to evaluate. We'll see what happens. Fingers crossed for a hard spike up into Friday, unless you've stopped yourself out of the calls already.
Yeah I am stopped, it was my fault. I was concentrating on getting the same amount on both I didn't even noticed I was in the wrong month. I "TRY" not to hope as experience has shown it doesn't happen. Best I can do is stop the bleeding and try try try again. I still have 3 days left in the week I am sure I can pull out of that.
But like I said we would get some nice trades out of this box we were in and we did.
But like I said we would get some nice trades out of this box we were in and we did.
Emini Day Trading /
Daily Notes /
Forecast /
Economic Events /
Search /
Terms and Conditions /
Disclaimer /
Books /
Online Books /
Site Map /
Contact /
Privacy Policy /
Links /
About /
Day Trading Forum /
Investment Calculators /
Pivot Point Calculator /
Market Profile Generator /
Fibonacci Calculator /
Mailing List /
Advertise Here /
Articles /
Financial Terms /
Brokers /
Software /
Holidays /
Stock Split Calendar /
Mortgage Calculator /
Donate
Copyright © 2004-2023, MyPivots. All rights reserved.
Copyright © 2004-2023, MyPivots. All rights reserved.