Hands free trading (or maybe head free trading)
Here's a straightforward strategy for the emini that is profitable in a trading market(read 70% of the time). W/L ratio approx 60%. Average profit to loss approx 1.20.
If the RTH close is below 50% of the daily range then buy at close. Place stop equidistant(yesterdays high to yesterday's close) below entry point. Use a catastrophic 30 point maximum stop loss, if necessary. Target is twice the range from yesterdays high to entry point (ie 2-1 RR)
Use some sort of trailing stop, the looser the better after BE.
Simple but perhaps not easy for those with twitchy fingers ;-)
Can you provide backtest results for this strategy including maximum drawdown, Sharpe Ratio, and equity curve?
What do you mean by a "trading" market?
What do you mean by a "trading" market?
My initial back-testing (granted we're only talking ten months data) gave me the figs I mentioned. Three consecutive losses were the max drawdown. I forgot to mention that the strategy is always in the market,long or short - sometimes for several days.
<Can you provide backtest results for this strategy including maximum drawdown, Sharpe Ratio, and equity curve?>
A trading market for me is one in which gaps are filled within a week.
<What do you mean by a "trading" market?>
<Can you provide backtest results for this strategy including maximum drawdown, Sharpe Ratio, and equity curve?>
A trading market for me is one in which gaps are filled within a week.
<What do you mean by a "trading" market?>
3 consecutive losses of 30 points is nothing to sneeze at if you're talking about the ES. Most retail traders could never take the pain from that size of drawdown.
What was the Sharpe Ratio?
When you speak of gaps, are you only talking about those that occur during RTH?
Please post a pic of the equity curve.
What was the Sharpe Ratio?
When you speak of gaps, are you only talking about those that occur during RTH?
Please post a pic of the equity curve.
Look, I don't do Sharpe ratios and I have no interest in answering endless questions.
You've got to remember that you're talking to a six year old here ;-)
A little story of two traders. One is a seasoned industry veteran who knows everything there is to know about trading. He's written countless books, appeared frequently at popular seminars worldwide,has mentored thousands,is often quoted by CNBC and WSJ and is considered by many as the consumate market expert.
The other "trader" is a seven year old girl who loves Barbie dolls and is full of the joys of life.
To each is given $50,000 and the objective is to end up with more money than their opponent. The contest lasts for one day.
The little girl is given very simple advice in the form of a game -
something about getting the funny green things up to the Smiling Monster who is sitting on top of the mountain. The Grumpy Monster is sitting in the valley, much closer. Its all fun, a game. Colors changing, reds and greens.The Smiling Monster and the Grumpy Monster. She wins, she loses - no big deal. Theres always another game.
So who would you put your money on?
Of course, your left brain screams at you - the old man who knows everything.
However, your right brain sees what the left brain will never see and its only when you listen to both that you see the full picture.
<3 consecutive losses of 30 points is nothing to sneeze at if you're talking about the ES. Most retail traders could never take the pain from that size of drawdown.
What was the Sharpe Ratio?
When you speak of gaps, are you only talking about those that occur during RTH?
Please post a pic of the equity curve.>
Thanks for the parable.
If you're going to present a trading strategy on a forum, be prepared to answer follow-up questions and provide backup. If that's asking to much from you, then don't bother in the first place.
If you're going to present a trading strategy on a forum, be prepared to answer follow-up questions and provide backup. If that's asking to much from you, then don't bother in the first place.
Neath, Im alittle slow.Do you mind explaining further? Today the ES had a RTH range of 18.25 and the close was 879.25(pretty close to the bottom of the range)so would this be a buy on close today? What is the profit target and what is the initial stop? THanks
Rainman
I didn't really provide any explanation to my "strategy" so perhaps the following explanation might give you some insight into my thinking. Suffice to say that selling highs or buying lows is a risky business (if you're going to catch a falling knife then wear gloves)so we're looking for opportunities that merit the risk.
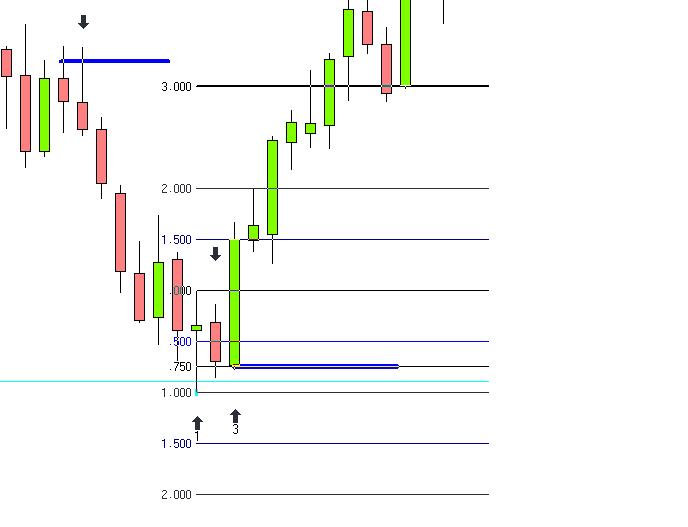
The attached is a daily ES chart (the March bottom for now) although it could just as well be a thirty minute chart. Same principle.
Look at all the candlesticks and note how many that closed near their high or low, met or exceeded that high or low the next day.
On to arrow 1. A higher close (for our purposes we're looking at each individual bar rather than net change so a bar that closes above its midpoint is bullish whether or not it closes above the close of the previous bar). Now we have a reasonable expectation that bar 1 should initially meet or exceed its high on the subsequent bar. It doesn't so that draws our attention.
Arrow 2
A bearish inside bar. The expectation is that it will meet or exceed its low and likely the low of the previous bar. It closes below the 50% point but not below the 75% point. Still bearish but everyone and their uncle is selling. The odds definitely favor more downside but the risk/reward ratio has shifted. If the next bar doesn't penetrate the low of bar 1 then there's the possibility of a sharp ride north.An aggressive trader would buy at this level statistically expecting a small loss or a huge gain.
Arrow 3
Off to the races. Easy to spot in hindsight but illustrative of the way markets work...sometimes!
Hope that gives food for thought and not indigestion ;-)
nb the arrow to the left shows the same set up.
I didn't really provide any explanation to my "strategy" so perhaps the following explanation might give you some insight into my thinking. Suffice to say that selling highs or buying lows is a risky business (if you're going to catch a falling knife then wear gloves)so we're looking for opportunities that merit the risk.
The attached is a daily ES chart (the March bottom for now) although it could just as well be a thirty minute chart. Same principle.
Look at all the candlesticks and note how many that closed near their high or low, met or exceeded that high or low the next day.
On to arrow 1. A higher close (for our purposes we're looking at each individual bar rather than net change so a bar that closes above its midpoint is bullish whether or not it closes above the close of the previous bar). Now we have a reasonable expectation that bar 1 should initially meet or exceed its high on the subsequent bar. It doesn't so that draws our attention.
Arrow 2
A bearish inside bar. The expectation is that it will meet or exceed its low and likely the low of the previous bar. It closes below the 50% point but not below the 75% point. Still bearish but everyone and their uncle is selling. The odds definitely favor more downside but the risk/reward ratio has shifted. If the next bar doesn't penetrate the low of bar 1 then there's the possibility of a sharp ride north.An aggressive trader would buy at this level statistically expecting a small loss or a huge gain.
Arrow 3
Off to the races. Easy to spot in hindsight but illustrative of the way markets work...sometimes!
Hope that gives food for thought and not indigestion ;-)
nb the arrow to the left shows the same set up.
Click image for original size
And to answer your question, Rainman. If this were day 1 then you'd buy on close with a stop loss at 865.00 (HOD 893.50 minus 879.25 CLOSE = 14.25).
A pretty uncomfortable ride for sure if you were to watch it unfold. However,monitoring the ticks is an exercise in futility. I'd be out at the gym, playing golf or doing something more satisfying than watching numbers on a screen. At this point, I'd move my stop to BE if/when price hits 886.50 (half the distance between yesterdays HOD and close) and my target would then be 908 at a minimum (twice the range).
If stopped out, rinse and repeat.
<Neath, Im alittle slow.Do you mind explaining further? Today the ES had a RTH range of 18.25 and the close was 879.25(pretty close to the bottom of the range)so would this be a buy on close today? What is the profit target and what is the initial stop? THanks>
Thanks, Ill keep on eye on this.
Emini Day Trading /
Daily Notes /
Forecast /
Economic Events /
Search /
Terms and Conditions /
Disclaimer /
Books /
Online Books /
Site Map /
Contact /
Privacy Policy /
Links /
About /
Day Trading Forum /
Investment Calculators /
Pivot Point Calculator /
Market Profile Generator /
Fibonacci Calculator /
Mailing List /
Advertise Here /
Articles /
Financial Terms /
Brokers /
Software /
Holidays /
Stock Split Calendar /
Mortgage Calculator /
Donate
Copyright © 2004-2023, MyPivots. All rights reserved.
Copyright © 2004-2023, MyPivots. All rights reserved.