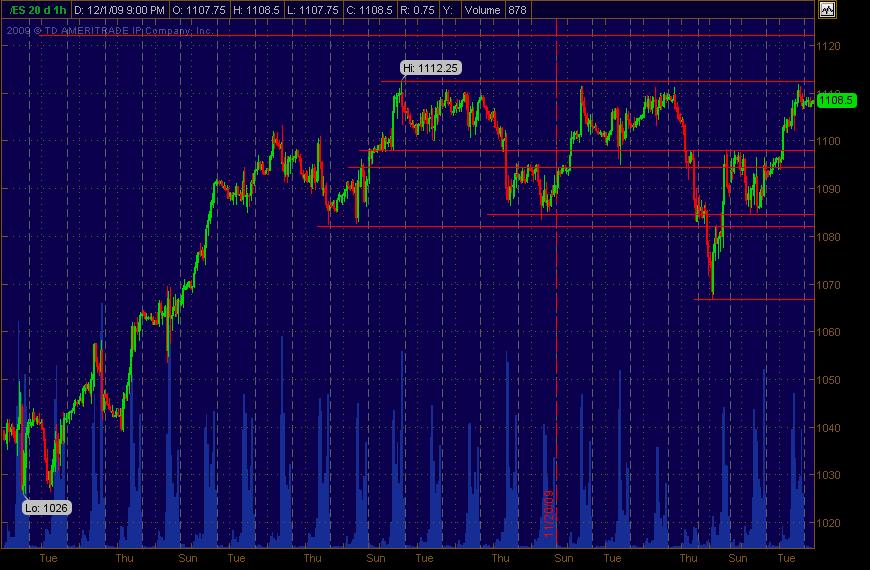
ES S/R Map for 12-2-09
Using a chart out of Thinkorswim of ES and drew in red lines at what looked like signif potential S/R price areas.
Click image for original size
And for anyone trading stocks ... on Monday had TSL,CREE and SEED long. And will be watching long for NANO and PCP in the coming days. Mkt move up the past two days may mean some of these stocks need a rest (consol/pullback) before acting on 'em if they show movement back up. That's just what I'm looking at for now ... my cent and a half.
Click image for original size
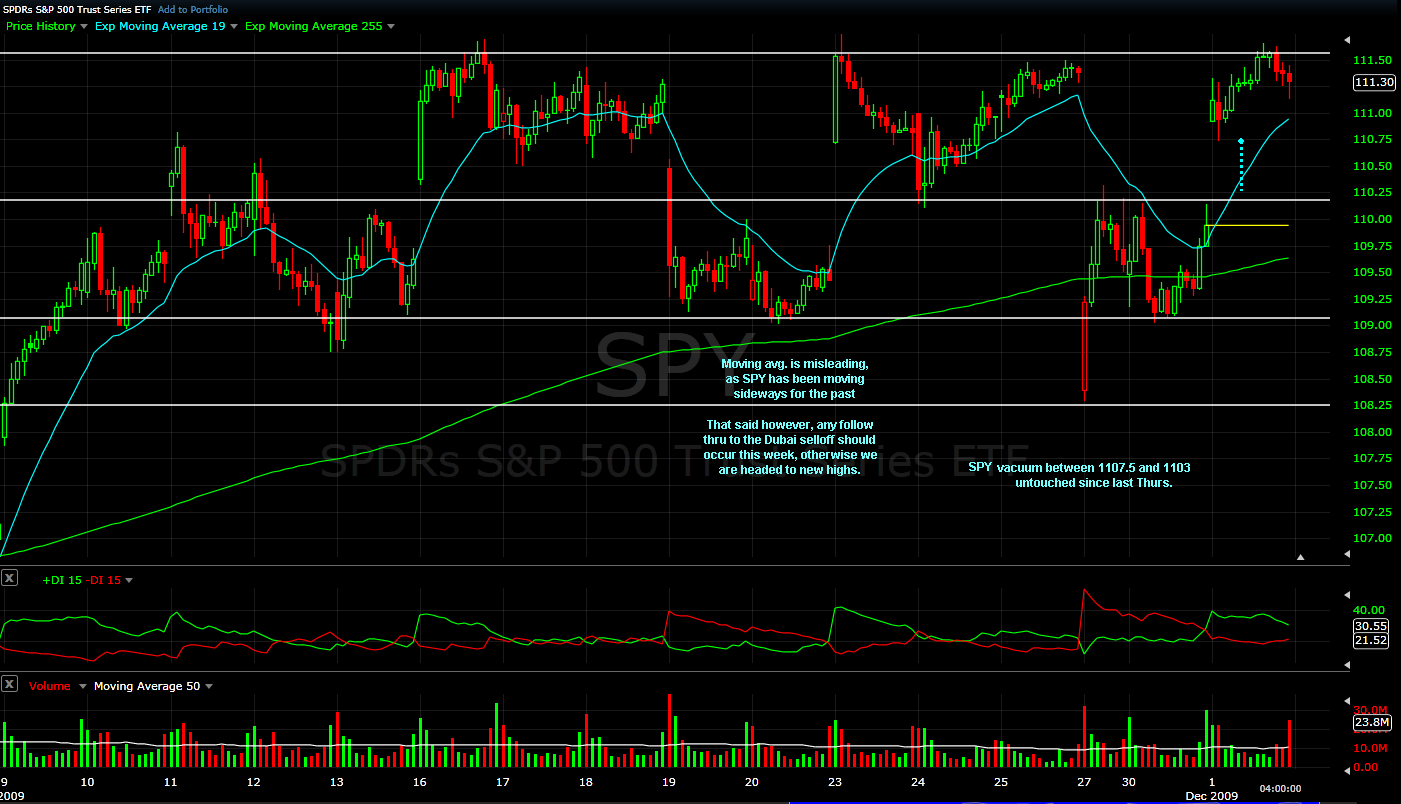
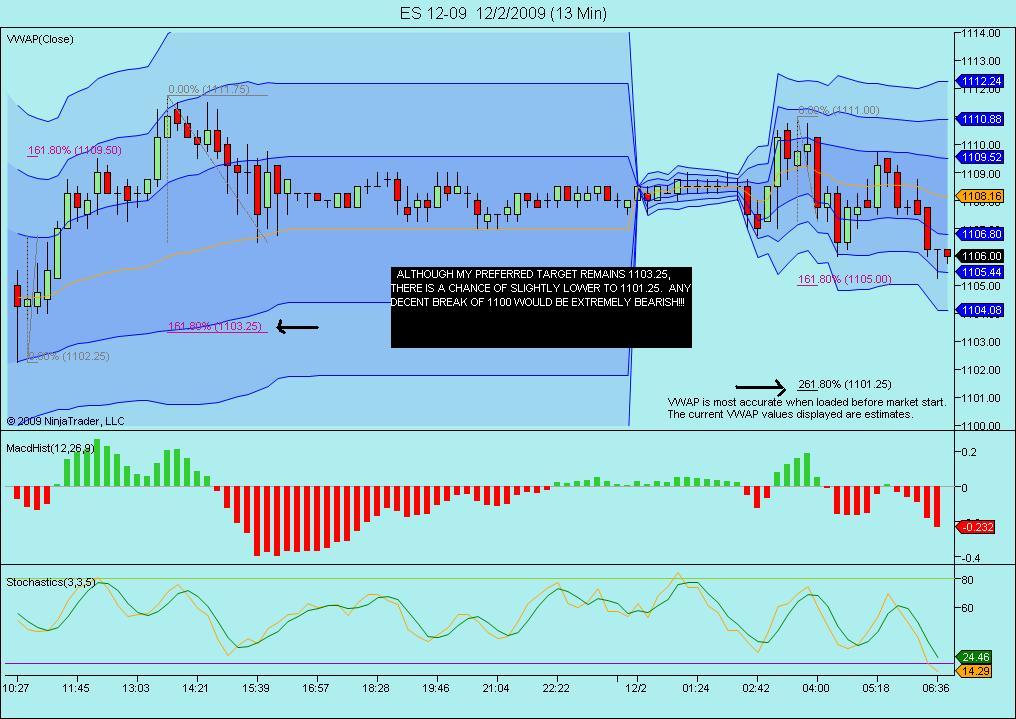
After staring at the charts for a good hour, i came to the conclusion that I really don't know whether we see new yearly highs tomorrow, but regardless, i think there's a good chance we will re-visit 1103.
Hey Phileo, thanks for the chart and analysis. Could you go into more detail as to why you're looking for that 1103 level or others with your approach to the markets? In other words, spell out the actual analysis behind the strategery ... and what the strategery is. This is much appreciated mister!!
MM
MM
Here's an updated version of the chart I posted initially. It includes not only the price action S/R lines in red but also the Wkly Mid Pvt in White ... and the Wkly S1 in Green ... along with the daily S1 and R1 as magenta dashed lines. There's some confluence/clustering at a couple of price levels. Perhaps there's some fib levels that coincide with some as well. It's a better "map" with more info for coming into Wednesday's trading session.
Click image for original size
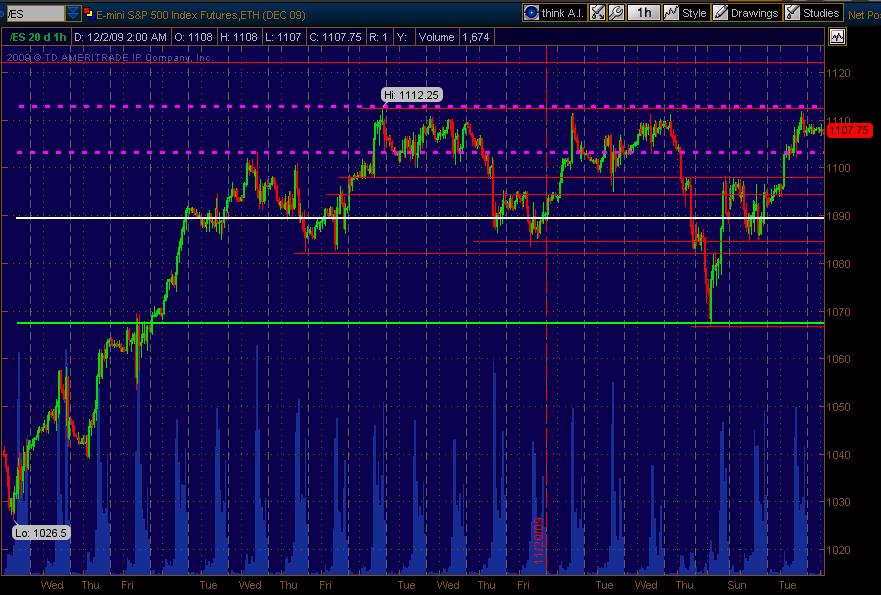
Click image for original size
...and yes, Monkey, you will see new highs soon! Dont know what day , but ive been saying this all thru the so called Dubai crisis, because its what the technicals tell me. next good panic low near Christmas?Originally posted by MonkeyMeat
Hey Phileo, thanks for the chart and analysis. Could you go into more detail as to why you're looking for that 1103 level or others with your approach to the markets? In other words, spell out the actual analysis behind the strategery ... and what the strategery is. This is much appreciated mister!!
MM
Hi MM,
If you look at the chart i posted, one interesting pattern (other than the fact that it is moving sideways for the past 3wks) that i noticed is that the day after the impulse surge to resistance, price would pullback and search for support. History rhymes, so I believed it would do the same pullback today after yesterday's test of 1111.
So my likely scenarios for today were:
1. Test resistance 1111, fail, and search for support
2. Break above 1111 resistance, fail, and search for support.
3. Break above 1111 resistance, stick and follow thru.
when was the last time you saw ES break above a major resistance level and make a follow thru move in the same session after a 40pt run up prior? Odds are stacked against 3rd scenario happening.
I didn't know which scenario would happen (45/45/10 in my mind), but I believed in the search for support, with good odds, and also because that's what it did the past two times.
As it turns out, I tried to play the break out, and got burned, but got my head back on my head, and stuck to my analysis, went short 1112.5, and made up for the loss and then some.
Thanks Phileo. Good scenario breakdown there ... much appreciated. Glad you got the "good" trade off and made some hack!
Emini Day Trading /
Daily Notes /
Forecast /
Economic Events /
Search /
Terms and Conditions /
Disclaimer /
Books /
Online Books /
Site Map /
Contact /
Privacy Policy /
Links /
About /
Day Trading Forum /
Investment Calculators /
Pivot Point Calculator /
Market Profile Generator /
Fibonacci Calculator /
Mailing List /
Advertise Here /
Articles /
Financial Terms /
Brokers /
Software /
Holidays /
Stock Split Calendar /
Mortgage Calculator /
Donate
Copyright © 2004-2023, MyPivots. All rights reserved.
Copyright © 2004-2023, MyPivots. All rights reserved.