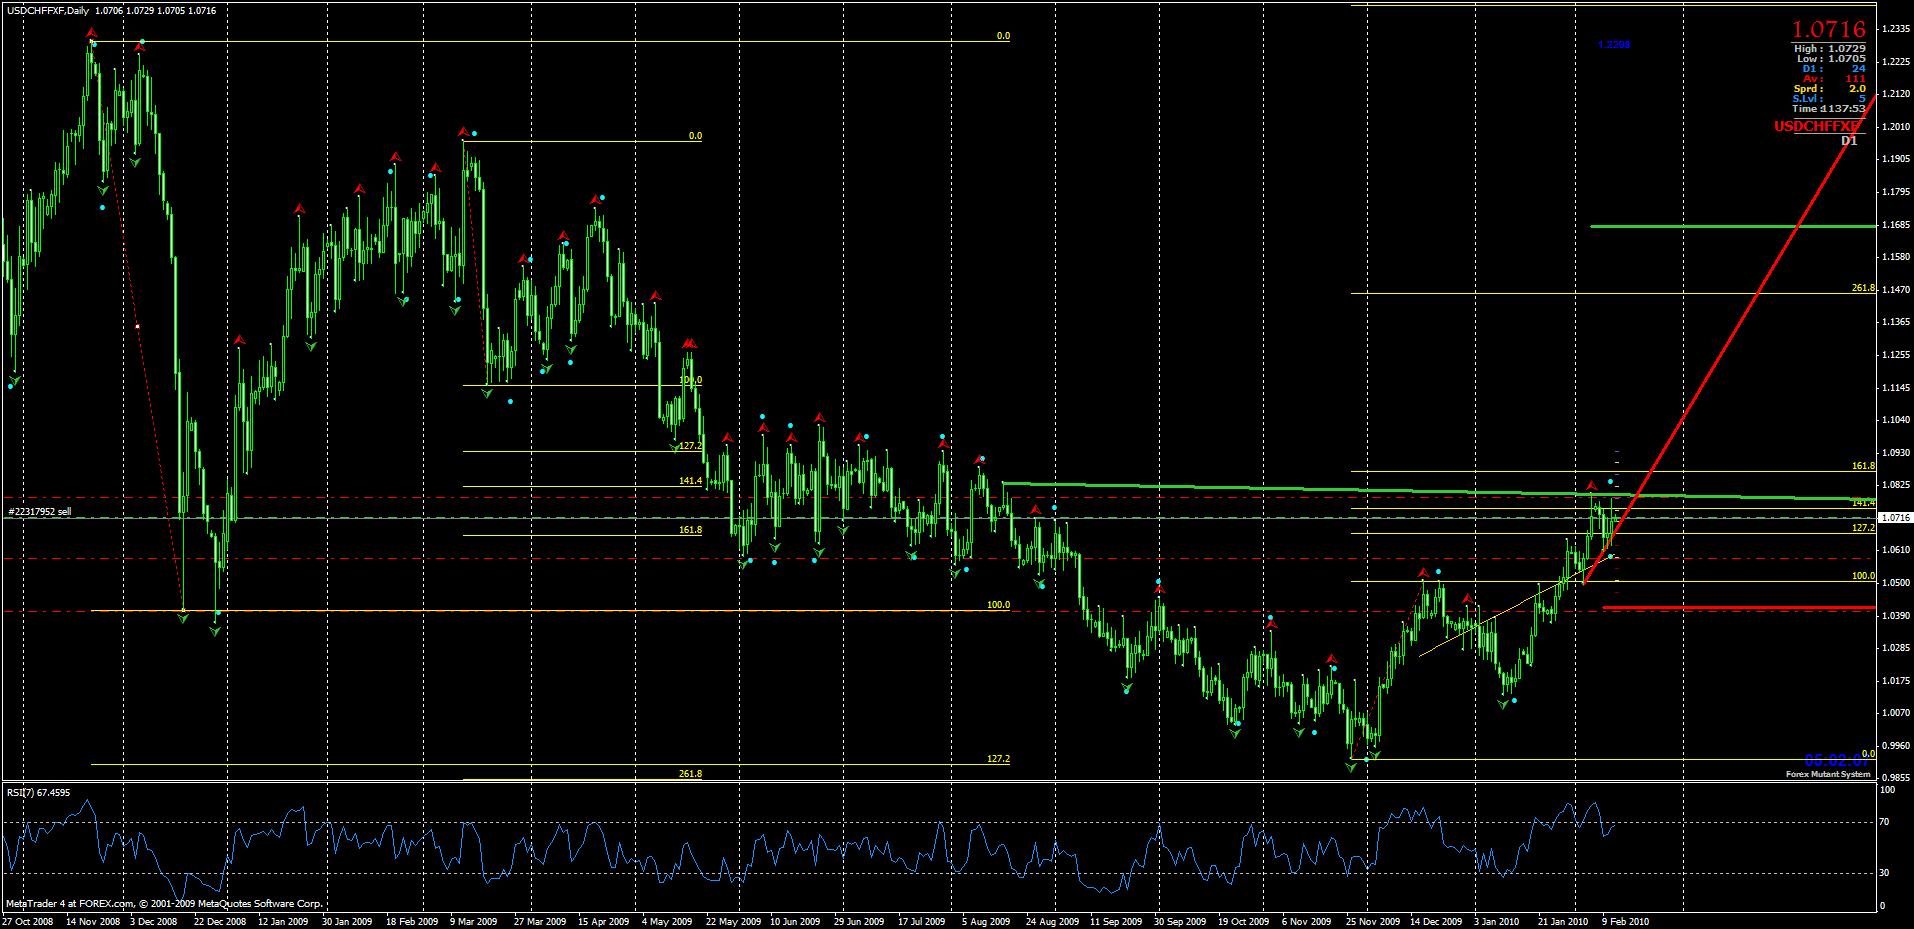
This is the daily chart. Getting the hang of this daily chart trading. Just use a mini lot(0.1) or micro lot(0.01).
Use huge stops, huge targets and let it run for a few days or weeks.
Looking at the symmetry of the bowl shape, approximately 3 months from the low(11-26-09) to the current high. Left of that low is approximately 3 month.
Found another likely fib extension for a bounce is 141.4% Seems to happen quite a number of times before it moves for the 161.8% extension.
Currently short on this pair. 1 lot. Taking half off at 1.0585 and the last half at 1.0407.
Click image for original size