1172.50 is my magnet
should be a fun one today
now that 80 has printed in RTH the 76.75 needs to be the first magnet
Click image for original size
Hey Kool - welcome back - good to see you again.
Good call Bruce!
Good call Bruce!
Click image for original size

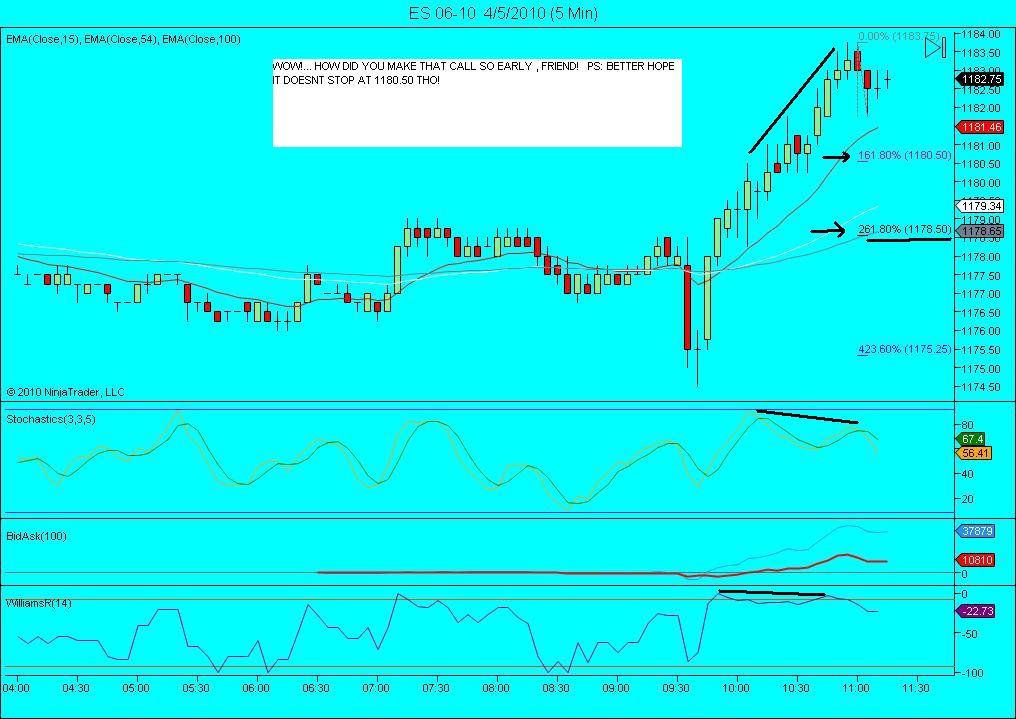
If this 82 holds...which I don't think it will then they will try for 1190 - 92 today.....I'll get to charts of my failures later to add to the 72 and 76.50 concept.....it's all volume and air...nothing new really but today us faders had some challenges
Nq has it's high volume bars at the highs today...so did that sucker everyone in long ? YM is below the overnight highs.....this is a market in conflict...I don't buy that we are trending...It's not unrealistic to leave the market high over lunch to attract the people with real jobs.....
They check the market over lunch and say " Hey this market is going to take off with out me so a I better buy now"..so they buy at the highs....perhaps today they will win but untill we accept that volume in the NQ at higher prices we are going to chop or rollover down...perhaps the ES will run out those stops near the highs first.....and so goes a faders attitude......the worst case scenario is that we have losses today...we acceept it and move on !!Ok, todays speech is over now..
They check the market over lunch and say " Hey this market is going to take off with out me so a I better buy now"..so they buy at the highs....perhaps today they will win but untill we accept that volume in the NQ at higher prices we are going to chop or rollover down...perhaps the ES will run out those stops near the highs first.....and so goes a faders attitude......the worst case scenario is that we have losses today...we acceept it and move on !!Ok, todays speech is over now..
Nq needs to test and not find support at 71.50 for us shorts to roll this over...
DT my call was for the ES 72.50 not the NQ...so I'm way off....so far !!!
Originally posted by day trading
Hey Kool - welcome back - good to see you again.
Good call Bruce!
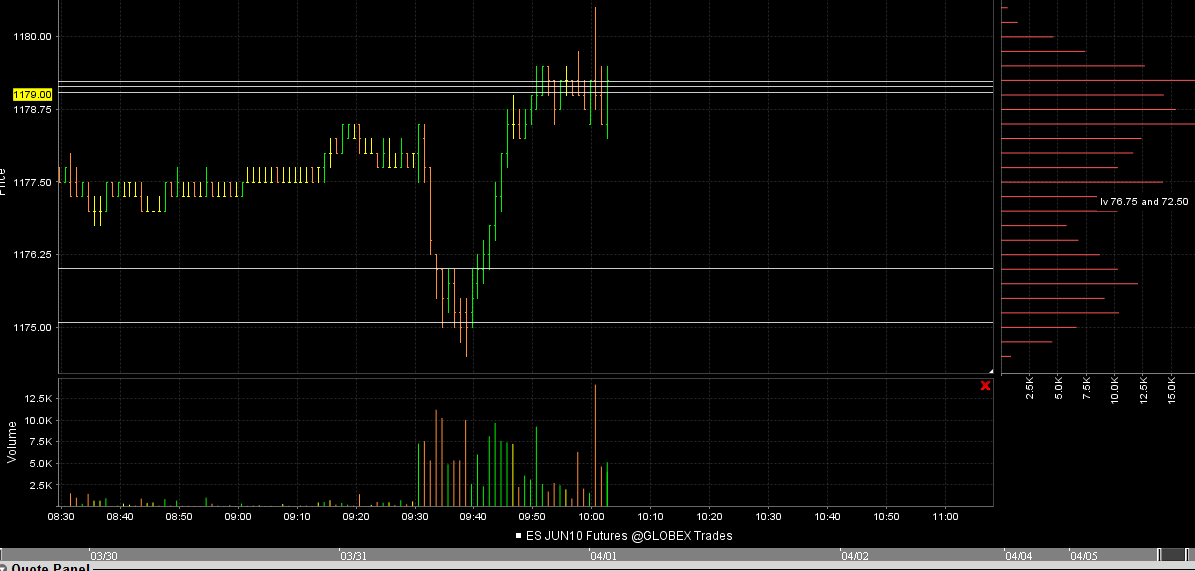
Here was my first short area that didn't go any where....we had the high volume into the overnight high near the 1180. Look at that volume thrust. 1176.75 was my initial target because very little time was spent there and we had what I call a "railroad track" of volume...the market quickly traded down through the overnight low and then rallied back up thorugh that low very quickly.
Ignore my text but look at the 1176.75 on the price/time histogram..right side..they like to fill in all these as per the Price bar overlap thread...some are harder to see...this trade didn't work but the concept is key....1172.50 has one from last Thursdays trade.....and so the heading of this thread
Ignore my text but look at the 1176.75 on the price/time histogram..right side..they like to fill in all these as per the Price bar overlap thread...some are harder to see...this trade didn't work but the concept is key....1172.50 has one from last Thursdays trade.....and so the heading of this thread
Click image for original size
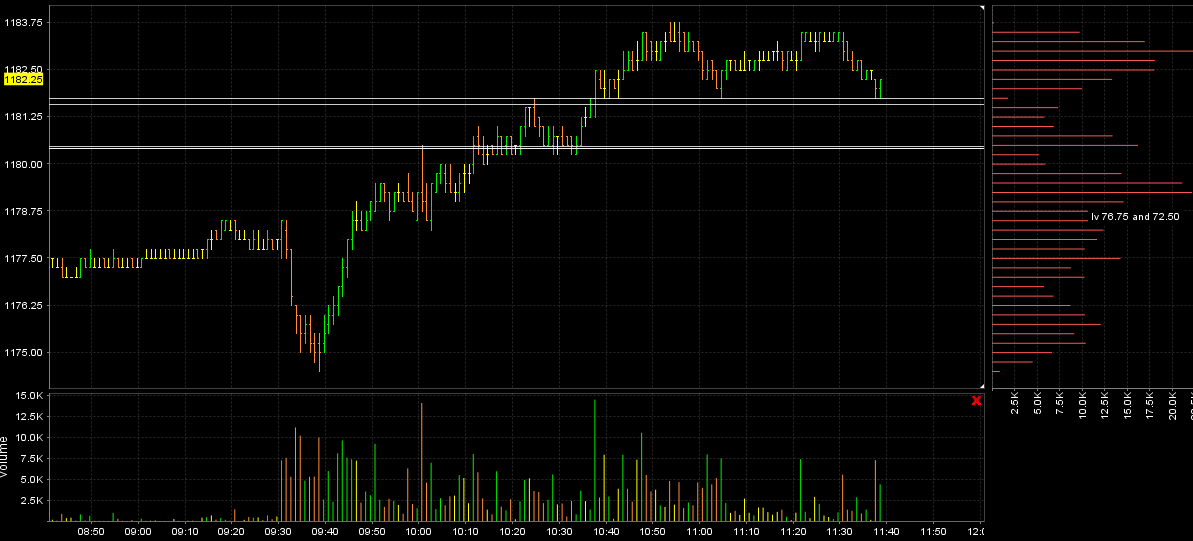
we get the next volume thrust at about 10:35...look again at the price histogram and notice the 1181.75 area ...no time spent there.....you will see this over and over and here is the usual sequence....
1) We have a key area that most are watching. It should be obvious like an overnight high or previous RTH high or a pivot etc...
2) You see the volume come in. The reality is that we could skip step 1 because we don't really need to know "why" an area is a key area. Watching the volume thrust lets us work off the principle that "Elephants leave tracks that we can follow. Now the high vertical volume leaves the "air pocket" behind - yawn, this is old stuff to us by now.
3)They are either going to accept price and keep running higher, forming full one minute bars above the thrust bars or they will roll it over and fill in the air. We know the usual answer. If your fading the thrust bars ( that form air pockets) you want the market to get below them ratther quickly and spend time there.
The great thing is that only on the strongest of trends will they keep pushing is up. Most days they will try to test them and much more. I think this was a poor rally today and wouldn't be surprised to see them go for the 1176.50 and the 1172.50 and soon.
Click image for original size
Emini Day Trading /
Daily Notes /
Forecast /
Economic Events /
Search /
Terms and Conditions /
Disclaimer /
Books /
Online Books /
Site Map /
Contact /
Privacy Policy /
Links /
About /
Day Trading Forum /
Investment Calculators /
Pivot Point Calculator /
Market Profile Generator /
Fibonacci Calculator /
Mailing List /
Advertise Here /
Articles /
Financial Terms /
Brokers /
Software /
Holidays /
Stock Split Calendar /
Mortgage Calculator /
Donate
Copyright © 2004-2023, MyPivots. All rights reserved.
Copyright © 2004-2023, MyPivots. All rights reserved.