free site, chart URL that draws R/S, pivot lines ?
Hi,
Is there a free charting site that draws pivot, R/S prices on the chart? Daily at least?
There's a fellow on stockcharts who has his "TED" lines which are prtty good, but coarse grained, not like R1, R2, S1, S2 closer together prices.
http://stockcharts.com/def/servlet/Favorites.CServlet?obj=ID2684038&cmd=show[s129091848]&disp=O
tnx, curt
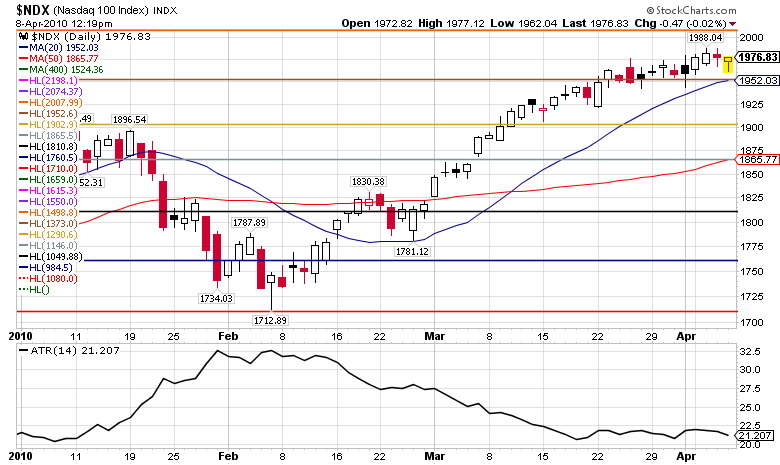
Click image for original size
Hi Curt,
Thanks for the link.
This site has pivotpoints for the upcoming day
http://www.mypivots.com/dn/?symbol=284
There are lots of kinds of PP calculations as you can see.
There are the retracement and extension levels as well.
Is this what you want?
Thanks for the link.
This site has pivotpoints for the upcoming day
http://www.mypivots.com/dn/?symbol=284
There are lots of kinds of PP calculations as you can see.
There are the retracement and extension levels as well.
Is this what you want?
That is a pretty nice page. Is there any notes or descriptions etc on it?
Originally posted by mdszj
That is a pretty nice page. Is there any notes or descriptions etc on it?
There's a link next to each item that connects to the dictionary page that explains the item that you are looking at.
Hi Blue, I use the mypivots R/S page frequently. My quest is to find a site that draws those prices on a price chart. Even the free stockcharts daily would be useful with the weekly R/S prices drawn.
Too many things to keep track of is a problem, then fib prices intra day cycles etc etc.
Not everyone has trade station and a script that pulls from mypivots or calcs them up from a built in. ;-(
tnx, curt
Too many things to keep track of is a problem, then fib prices intra day cycles etc etc.
Not everyone has trade station and a script that pulls from mypivots or calcs them up from a built in. ;-(
tnx, curt
Originally posted by curt504
Hi Blue, I use the mypivots R/S page frequently. My quest is to find a site that draws those prices on a price chart. Even the free stockcharts daily would be useful with the weekly R/S prices drawn.
Too many things to keep track of is a problem, then fib prices intra day cycles etc etc.
Not everyone has trade station and a script that pulls from mypivots or calcs them up from a built in. ;-(
tnx, curt
Hi Curt,
Yes I was wondering what you were after. I don't have Tradestation either, nor a place that automatically adds them to my chart. I also have lots of things to track -at this time too many. This is because I have not yet finalized my system and want to see what works.
I have a spreadsheet and it computes the pivot points and fib and extensions. I compute lots of other things and then come up with my concensus estimate for the day's high and low and Stop-runs and breakout and breakdown. So really, I just put only a few numbers on my chart.
I tracked the PP and fib retracement and ext for a while (posted on this site
http://www.mypivots.com/Board/Topic/4857/4/study-says-pivots-dont-work
)and I couldn't quite see how to determine when they work and not - and of course there are many variations.
I don't know if you'll find what you're looking for, but one observation I have found true for myself. I have noticed that when I have estimate (pp or anything else) I tend to "cement" my viewpoint into these. This means I am waiting for a move to come down to a certain level and it doesn't quite get there and I miss the upleg waiting for it to get to that "set" level.
Therefore I have found it is not a plus to put them on my graph.
Emini Day Trading /
Daily Notes /
Forecast /
Economic Events /
Search /
Terms and Conditions /
Disclaimer /
Books /
Online Books /
Site Map /
Contact /
Privacy Policy /
Links /
About /
Day Trading Forum /
Investment Calculators /
Pivot Point Calculator /
Market Profile Generator /
Fibonacci Calculator /
Mailing List /
Advertise Here /
Articles /
Financial Terms /
Brokers /
Software /
Holidays /
Stock Split Calendar /
Mortgage Calculator /
Donate
Copyright © 2004-2023, MyPivots. All rights reserved.
Copyright © 2004-2023, MyPivots. All rights reserved.