The secular bear
Interesting chart courtesy of Morgan Stanley (one of the original ppt members?)...
Click image for original size
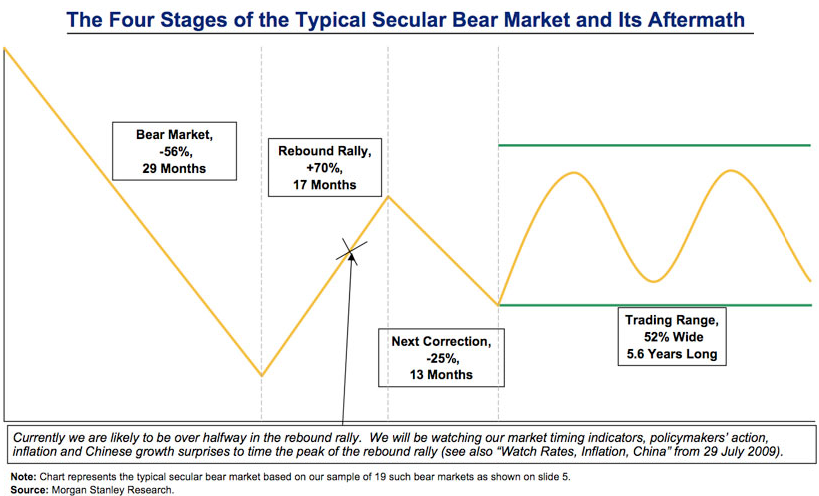
Hey kool, thanks for the post. I've had a copy of that chart for awhile now. I tend to agree that is a very likely scenario. Being a big fan of the 17.2 year cycle, wrapping up in 2017, this chart could fit very well with that. And, it implies the low is in. I'd prefer to see at least a nominal new low, but the 'norm' is as seen on the chart, and to range trade above the existing low.
The thing I find the most interesting, and amazing, is how few people understand the concept of the secular cycle. I hear traders I respect very much talk about how we are now in a new secular bull cycle, but they will never, ever say we are in a secular bear cycle. They act like they don't exist. I know people are born optimists, but it still makes no sense to pretend observed cycles don't exist, or simply won't happen again, and then talk about how the bull cycles surely will and are repeating. Just some thoughts...
The thing I find the most interesting, and amazing, is how few people understand the concept of the secular cycle. I hear traders I respect very much talk about how we are now in a new secular bull cycle, but they will never, ever say we are in a secular bear cycle. They act like they don't exist. I know people are born optimists, but it still makes no sense to pretend observed cycles don't exist, or simply won't happen again, and then talk about how the bull cycles surely will and are repeating. Just some thoughts...
A couple more examples of the bigger picture that i expect. Note that i am on record calling for a early 2011 high followed by a decline into at least Feb 2016 for a low....
Click image for original size
and of course, the last one....
Click image for original size
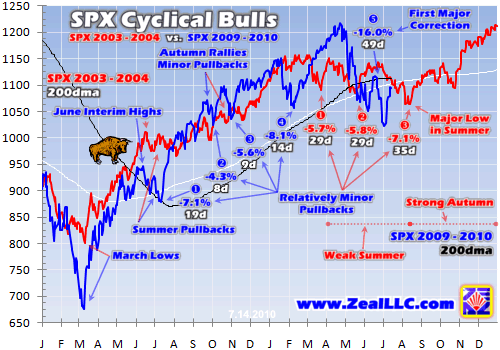
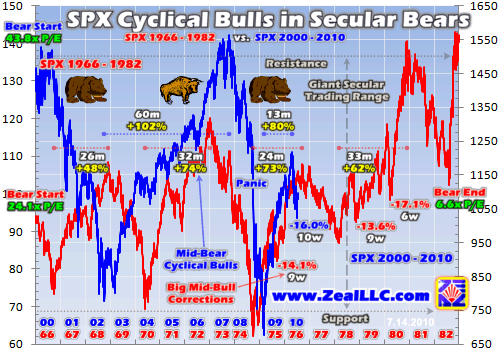
And for those trown off by the dramatic rally off of the mar'09 lows ,look at the comparisons with the first one in this secular bear which started in 2000. Courtesy ,Adam Hamiltons excellant work...
Click image for original size
Click image for original size
Emini Day Trading /
Daily Notes /
Forecast /
Economic Events /
Search /
Terms and Conditions /
Disclaimer /
Books /
Online Books /
Site Map /
Contact /
Privacy Policy /
Links /
About /
Day Trading Forum /
Investment Calculators /
Pivot Point Calculator /
Market Profile Generator /
Fibonacci Calculator /
Mailing List /
Advertise Here /
Articles /
Financial Terms /
Brokers /
Software /
Holidays /
Stock Split Calendar /
Mortgage Calculator /
Donate
Copyright © 2004-2023, MyPivots. All rights reserved.
Copyright © 2004-2023, MyPivots. All rights reserved.