Volume profile question
Question on Volume profile
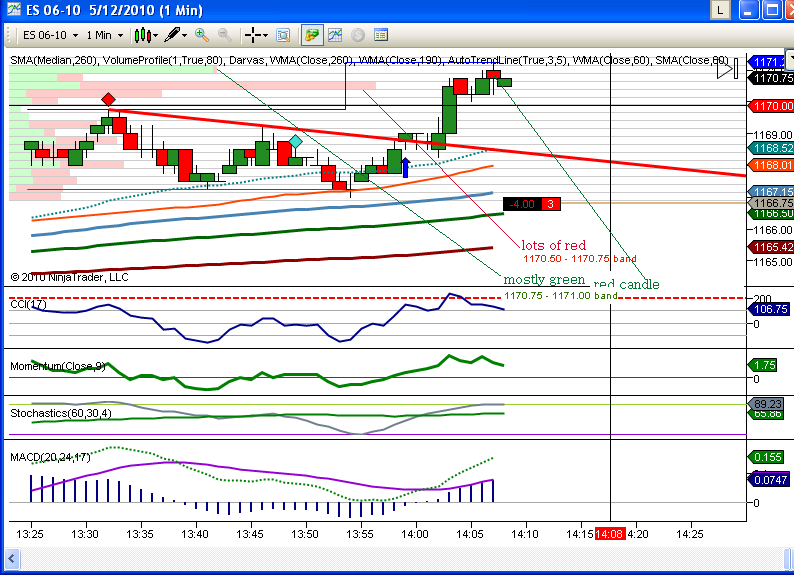
Does the mostly red bar mean that the majority of the trades in that bar were sales?
Does the mostly green bar mean that the majority of the trades in that bar were buys?
Does this graph mean that quite there was some new shorting in the 1170.50 to the 1170.75 band and that we had short covering in the 1170.75 to 1171 band?
Click image for original size
I'm not sure of your platform Blue...bid/ask and all that stuff still fools me so perhaps others have good ideas for time and sales stuff to help fiqure out WHO is actually in control at certain volume prices
sorry I can't be helpful here
sorry I can't be helpful here
Emini Day Trading /
Daily Notes /
Forecast /
Economic Events /
Search /
Terms and Conditions /
Disclaimer /
Books /
Online Books /
Site Map /
Contact /
Privacy Policy /
Links /
About /
Day Trading Forum /
Investment Calculators /
Pivot Point Calculator /
Market Profile Generator /
Fibonacci Calculator /
Mailing List /
Advertise Here /
Articles /
Financial Terms /
Brokers /
Software /
Holidays /
Stock Split Calendar /
Mortgage Calculator /
Donate
Copyright © 2004-2023, MyPivots. All rights reserved.
Copyright © 2004-2023, MyPivots. All rights reserved.