MyPivots
Forum
Daily Notes
Calculators
Pivot Point
Fibonacci
Market Profile
Gann Square of Nine
Day Trader Millionaire
Mortgage
All Investment Calculators
Glossary
More
Economic Events
Software
Articles
Help
Search...
Sign In
MyPivots
Search
Forum
Daily Notes
Calculators
Pivot Point
Fibonacci
Market Profile
Gann Square of Nine
Day Trader Millionaire
Mortgage
All Investment Calculators
Glossary
More
Economic Events
Software
Articles
Help
Sign In
All Forums
Private Forums
Kane Trading Group
30-year TYX
MA
Mats
Rep: 100
Posts: 262
1
16 years ago
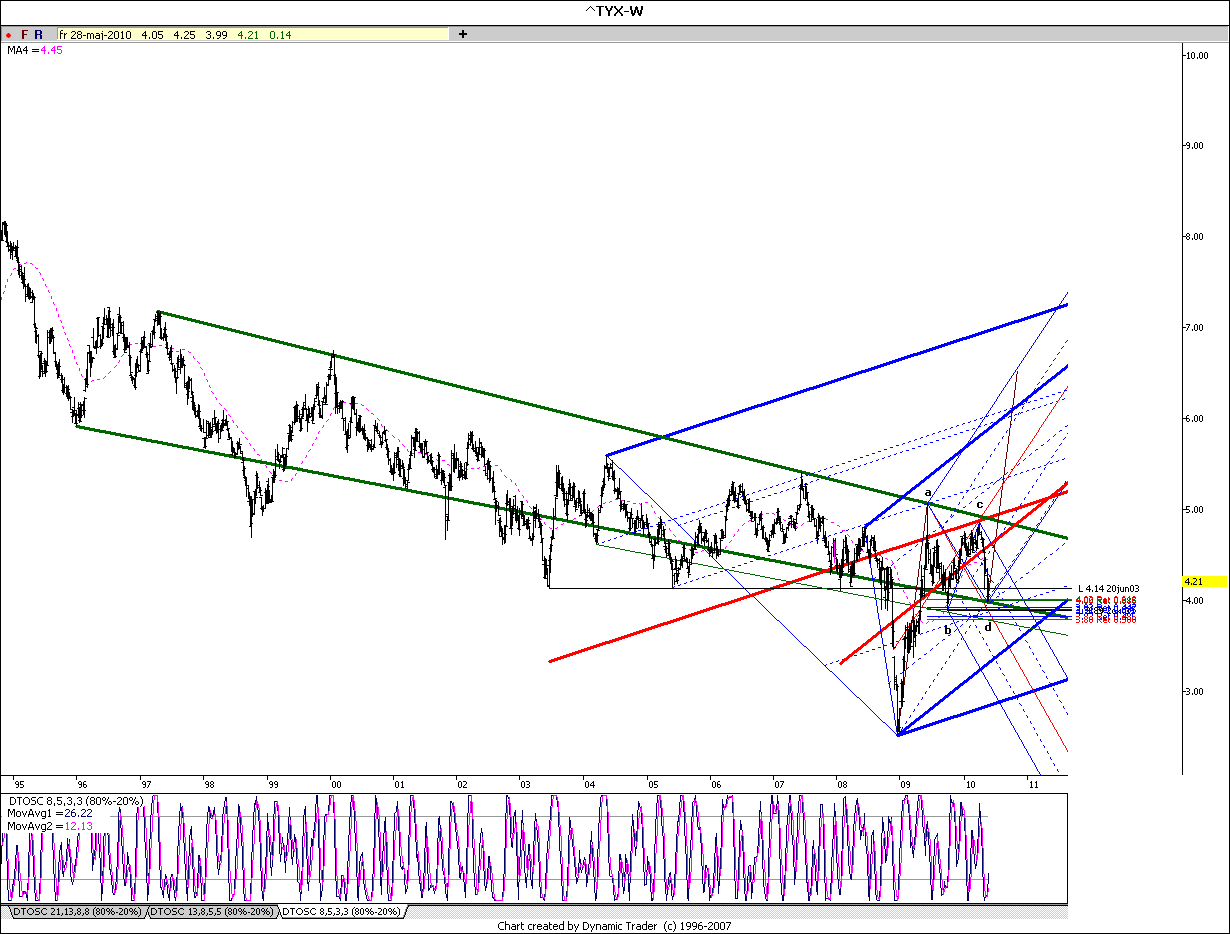
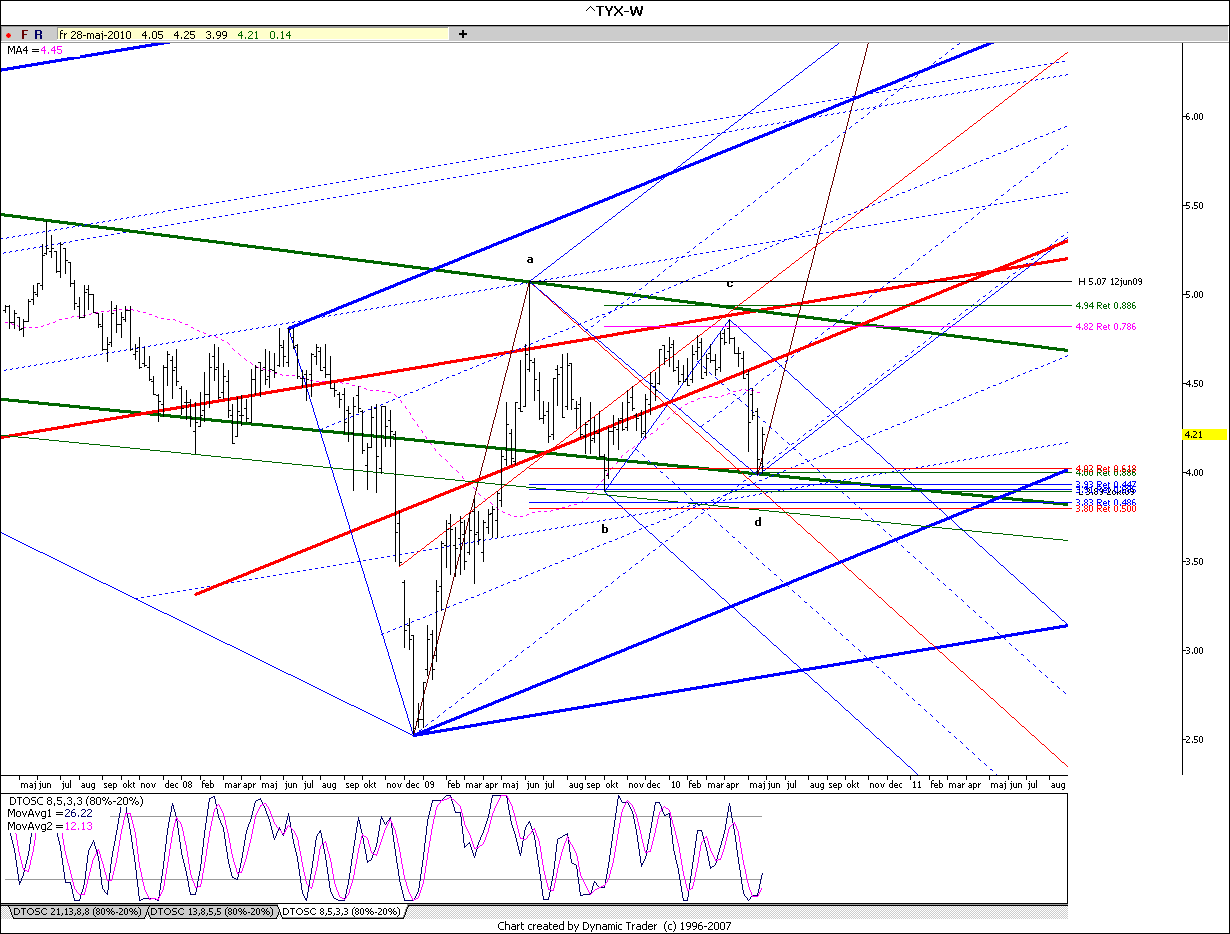
How I like this issue! with lines and channels that go 20, 30 year back in time.
Well I post a weekly chart of that. What I found and maybe can be an area to look for?
Click image for original size
Click image for original size
Mats
JI
jimkane
Rep: 3,058
Posts: 33,089
0
16 years ago
Mats!,
Thanks for posting. Ah, the implications of that setup. If rates started to explode, well, that would be it.
MA
Mats
Rep: 100
Posts: 262
0
16 years ago
Jim I have a question. Do you look at that area at all? Or is there another approach that I have overlooked.
Mats