Looking for Mr. Goodbar! (es preview)
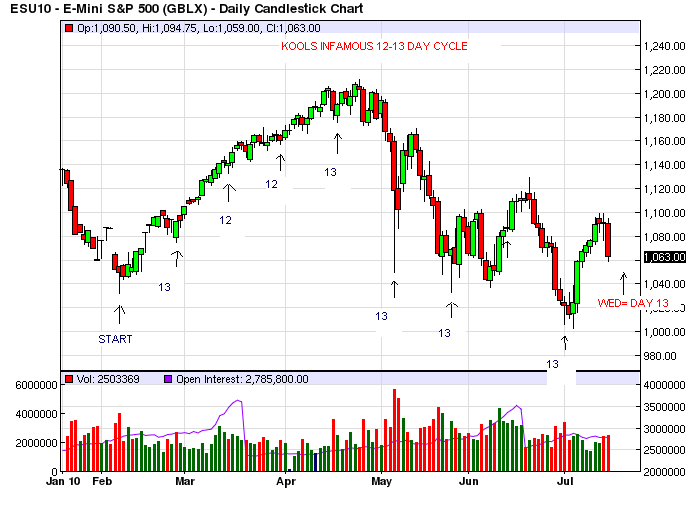
Well, as i stated,the high ticks last week forecast a tendancy for a decent pullback,which we started Friday. On a short term basis,the adv/dec etc. argue for higher highs in the future (over last weeks 1099.25). Long term cycles are up into early Aug.This pullback is to be expected ,hitting some decent support right here (projections of 1061-2)at previous wave 4 support around 1058 spx. If this zone doesnt hold then i suspect we would continue down to the daily 2.618 (1099.25-1076.25)around 1037-1039. I see the daily chart shows air closing at 1038.50 and i think Bruce has some key vol. or breakout numbers around there. Regardless of if we hold here, or continue to there, im thinking wed could be a good bar for a short term reversal...heres why...
Click image for original size
Click image for original size
Click image for original size
Also we have these Gann isms next week...7/21/10 - 7/22/10 - (30 TD from 6/8/10 low, 60 TD from 4/26/10 high, 120 TD from 1/29/10
low), 180 TD from 11/2/09 low, 240 TD from 8/7/09 high, 270 TD from 6/23/09 low) Be forewarned, anything can, and probably will happen but the 'tendancy' around mid week seems clear!
low), 180 TD from 11/2/09 low, 240 TD from 8/7/09 high, 270 TD from 6/23/09 low) Be forewarned, anything can, and probably will happen but the 'tendancy' around mid week seems clear!
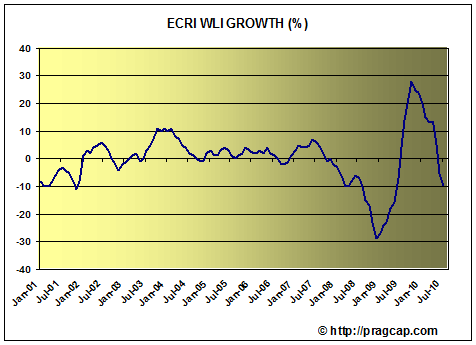
And a little longer term, but regarding the secular bear..check this out from Yelnick...The count down is getting closer to the double dip: 10 - 9 - 8 - 7 - 6: ECRI's growth index is now at -9.8% after a pretty big drop from -8.3% last week (which was revised this week to -9.1%; even the revisions are making the case for a double dip). It is hovering right above the -10% level that David Rosenberg has shown from past examples has always predicted a recession ahead (42 years of data). We should crush through that next week, but that is now just a technicality; Rosenberg gave the -10% level as an easy line in the sand; -9.8% also in the past 42 years always predicted a recession in about six months, which puts it in 1Q11.
Ecrijul9
Ecrijul9
Click image for original size
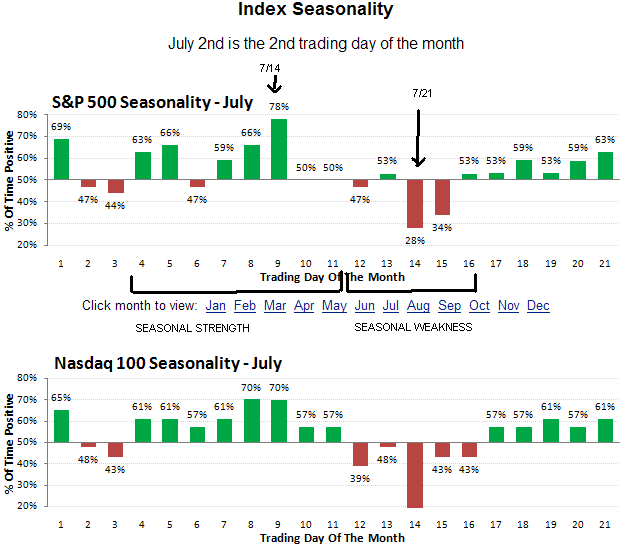
Back to the near term for next week and beyond...first the bullish case: big cycles are generally up untill spring 2011; the entire move from spx 666 to 1219 retraced a perfect 0.382 to 1010 and could be done,which portends higher prices;i think July is the 2nd strongest month of the year, statisically ,after Nov; the Adv/Dec ratios made higher highs at 1219 and at the recent 1099 levels strongly indicating those prices will be exceeded in time;we are oversold short term (hourly basis) and due for a move up at any time; earnings have been generally impressive and next weeks should be equally so...... and on the bearish side: The Jan-Feb decline occurred during good earnings!; last week was a bearish pattern of an early high and late weakness;the Dow has been down 7 of the last 11 weeks after expiration per Stock Traders Almanac; next week is the most bearish of the month per Sentimenttrader; the last 8 months the market has peaked mid month!(14th-21st);last week saw the 'death cross ' of the 50 day mov avg below the 200 day; prices hit the 200 day avg and reversed off of it strongly; new highs are NOT expanding and although since April, upside volume is rising,downside volume is rising faster!
Appreciate your thoughts Kool.
The cycle work is spot on and I'm with you on those ideas.
Your comments in the other thread about the mathematical workings of the market is superbly said and only scratches the surface.
I don't think this is about predicting the future. Quite the contrary, its about learning to live in harmony with the natural rhythms present throughout and within all creation.
Its a beautiful world, whatever ones beliefs may be.
Cheers!
Thx,Lorn! I really appreciate it.
Emini Day Trading /
Daily Notes /
Forecast /
Economic Events /
Search /
Terms and Conditions /
Disclaimer /
Books /
Online Books /
Site Map /
Contact /
Privacy Policy /
Links /
About /
Day Trading Forum /
Investment Calculators /
Pivot Point Calculator /
Market Profile Generator /
Fibonacci Calculator /
Mailing List /
Advertise Here /
Articles /
Financial Terms /
Brokers /
Software /
Holidays /
Stock Split Calendar /
Mortgage Calculator /
Donate
Copyright © 2004-2023, MyPivots. All rights reserved.
Copyright © 2004-2023, MyPivots. All rights reserved.