RO
roofer
Rep: 3,689
Posts: 3,574
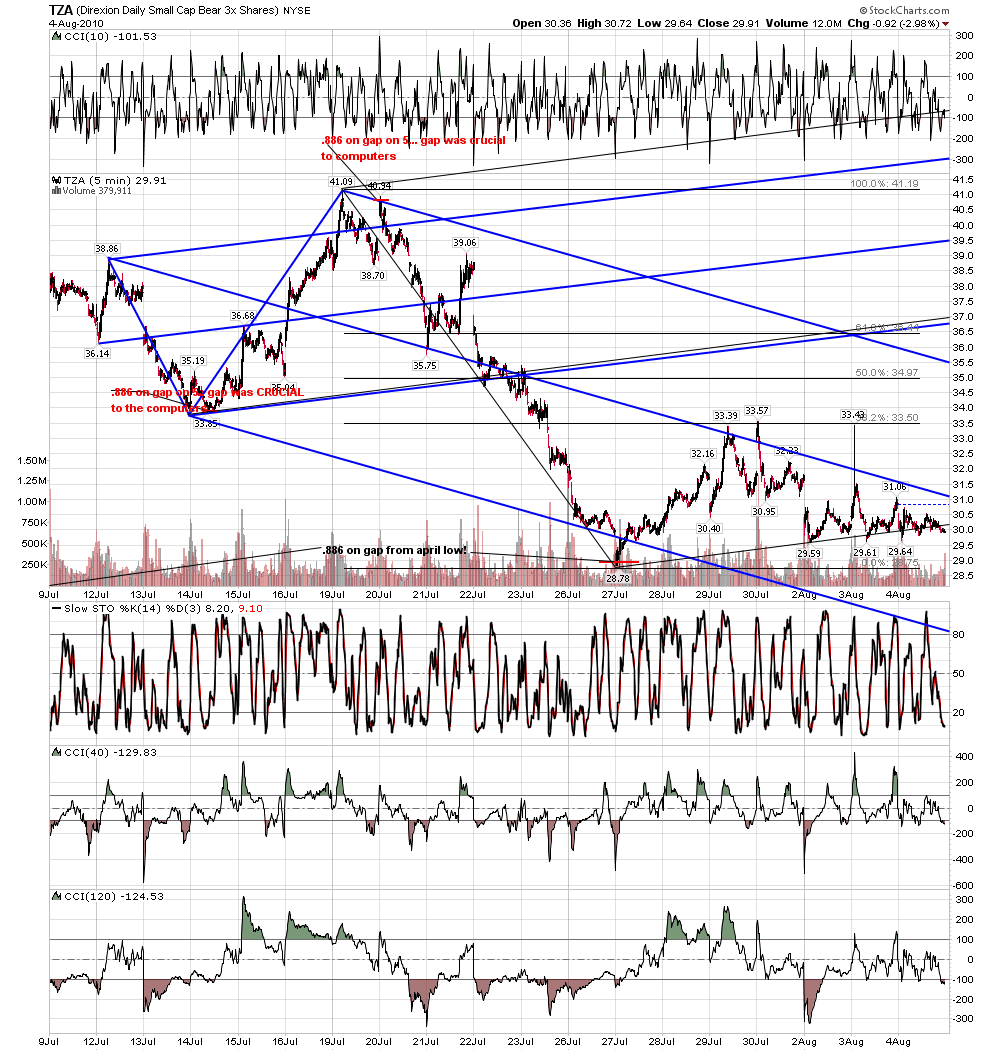
what we have seen here...in july 09, when some were saying the market was untradeable and my bullish stance seemed crazy, i pointed to the endless abcd's at .382 on my charts... jan 2010, i seemed rude in insisting upon the bearish case.but 95% of my 60 min charts were on sell signals... trusting the geometry i made my case.....at the feb lows stock after stock hit their down side targets... at the april highs, my increasing bearishness was called into question... but remember .. at important turns the geometry works better and better on smaller and smaller time frames... that is how the market signals its intent... go back to the april posts anbd see what was happening day after day.... at the july 3rd low, i just plain gave you the heads up.....now we are coming once again into a time when i am looking for a turn....all i am going to do for my own trading is do the boring grunt work and trust the geometry.... if a turn is at hand , the geometry will be there...