Reversal Pattern
I don't know if there is a name for this pattern but I like to look for them. I'm a pattern trader and they appear frequently enough.
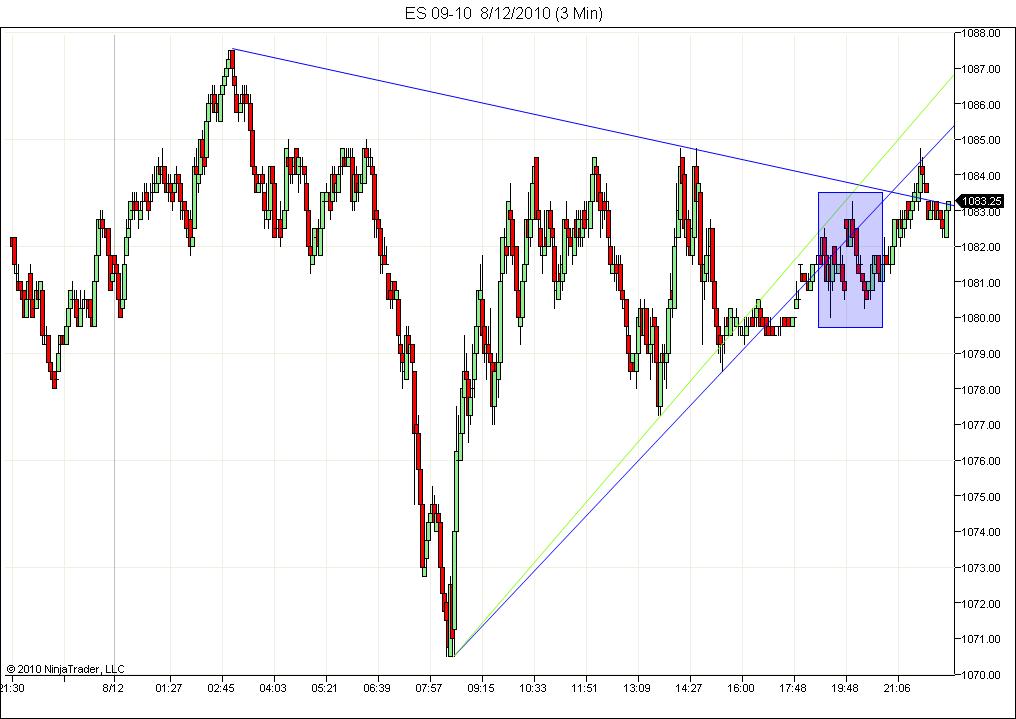
I had mentioned it in a post, but the wave did not terminate. So it can give two signals.
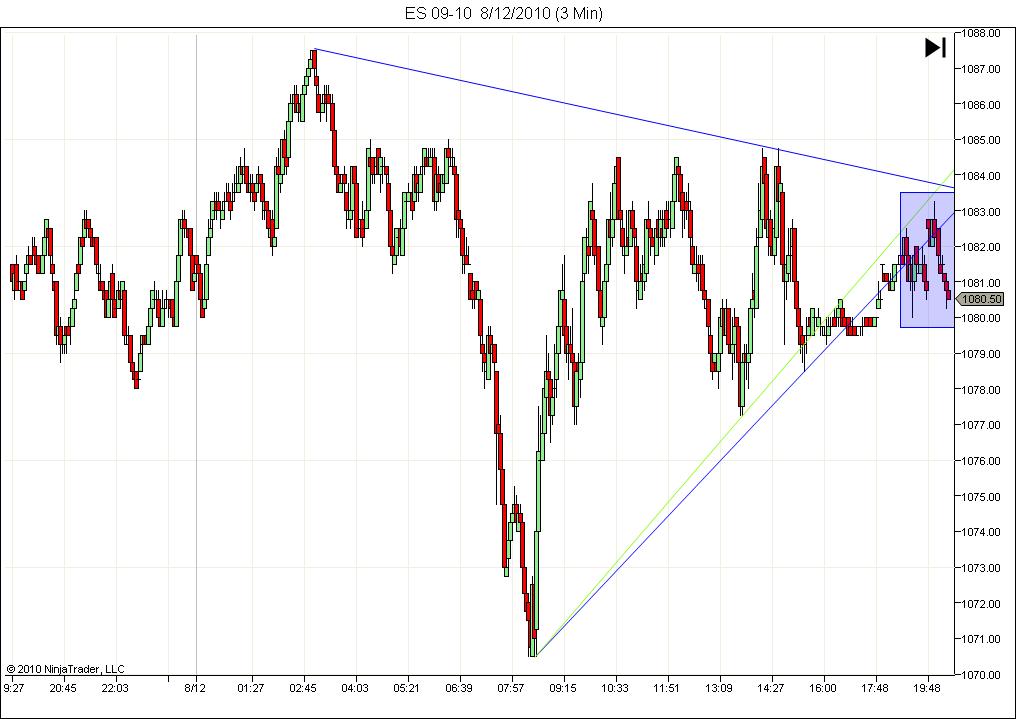
In the first chart note the third lower high after a double top came before it. Not a lot of support as upward trendlines keep breaking.
The pattern is a downward wave that terminates between the two previous lows. See the shaded area.
I had mentioned it in a post, but the wave did not terminate. So it can give two signals.
In the first chart note the third lower high after a double top came before it. Not a lot of support as upward trendlines keep breaking.
The pattern is a downward wave that terminates between the two previous lows. See the shaded area.
Click image for original size
I know this is only a 3 minute chart but the pattern is fractal from my exrperience. It works on all timeframes.
I'm not saying one can make a killing with it either. It's more important to be aware of it so you don't die by making the wrong entry in a trade. I hope this is helpful in your trading.
I'm not saying one can make a killing with it either. It's more important to be aware of it so you don't die by making the wrong entry in a trade. I hope this is helpful in your trading.
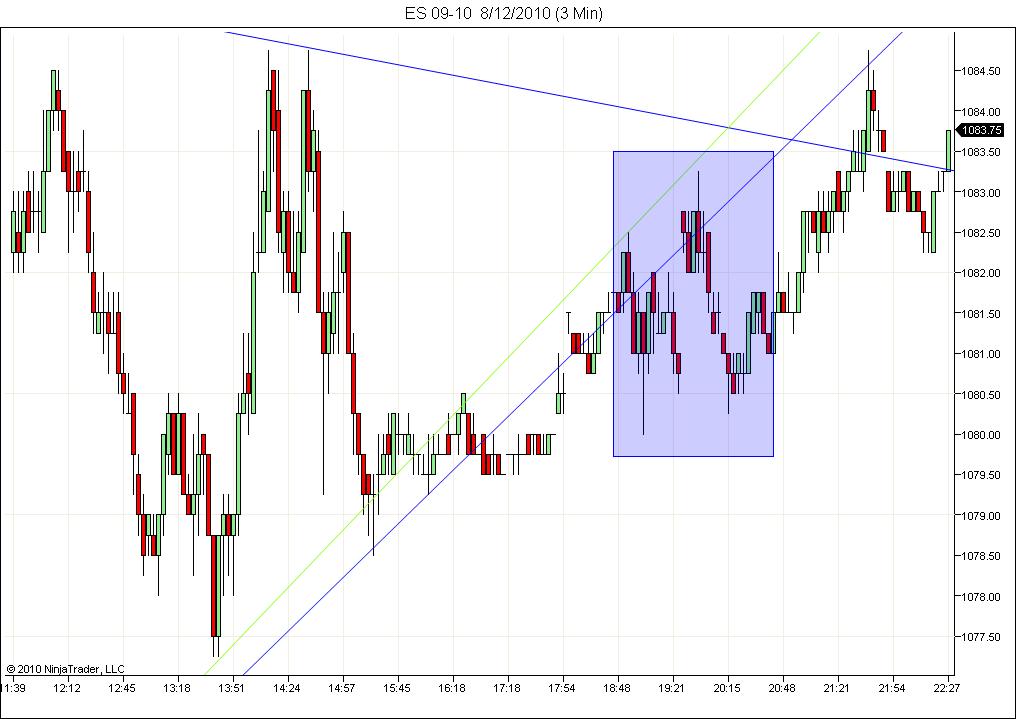
Click image for original size
Closeup. The wave terminates between the two previous lows.
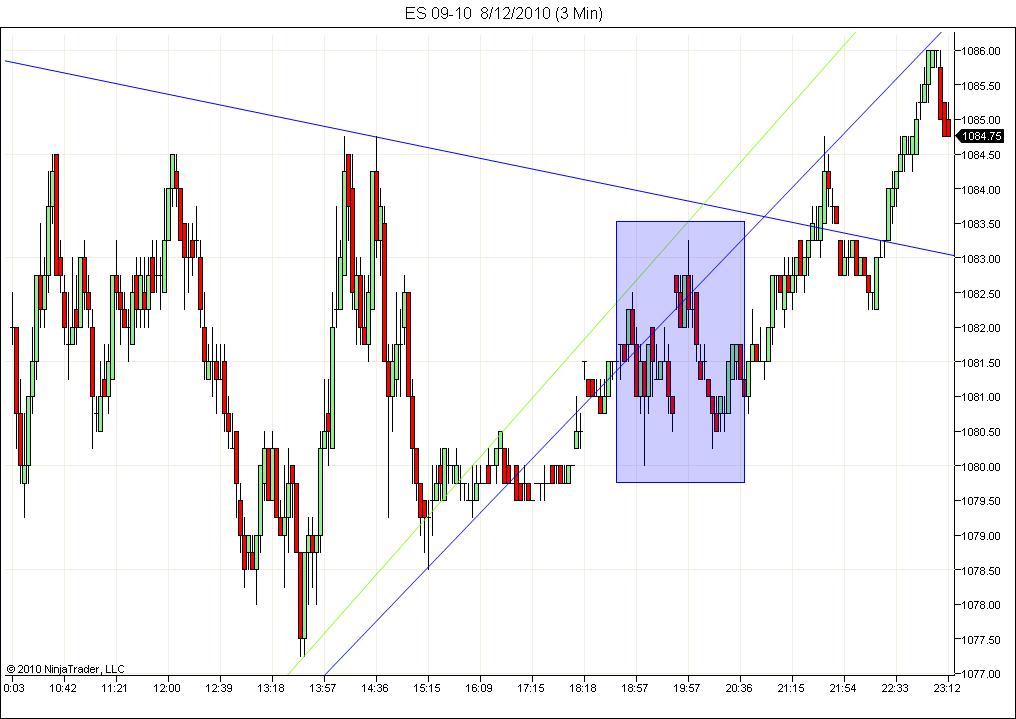
Click image for original size
This is what happens when the seemingly easy trade goes against you. It looked like a great short and a lot of traders obviously agreed.
This is a live after hours chart I'm using. Note the date and time of post and charts.
This is a live after hours chart I'm using. Note the date and time of post and charts.
Click image for original size
Emini Day Trading /
Daily Notes /
Forecast /
Economic Events /
Search /
Terms and Conditions /
Disclaimer /
Books /
Online Books /
Site Map /
Contact /
Privacy Policy /
Links /
About /
Day Trading Forum /
Investment Calculators /
Pivot Point Calculator /
Market Profile Generator /
Fibonacci Calculator /
Mailing List /
Advertise Here /
Articles /
Financial Terms /
Brokers /
Software /
Holidays /
Stock Split Calendar /
Mortgage Calculator /
Donate
Copyright © 2004-2023, MyPivots. All rights reserved.
Copyright © 2004-2023, MyPivots. All rights reserved.