ES Short Term Trading 8-31-2010
Range Based S/R
R1 = 1079.75
S1 = 1037.50
R2 = 1086.75
S2 = 1030.25
Steenbarger Pivot = 1051.75
I'm adding volatility S/R today since today's range was so large.
R1 = 1061.75
S1 = 1041.50
R2 = 1065.25
S2 = 1038.25
R3 = 1068.50
S3 = 1035.00
R1 = 1079.75
S1 = 1037.50
R2 = 1086.75
S2 = 1030.25
Steenbarger Pivot = 1051.75
I'm adding volatility S/R today since today's range was so large.
R1 = 1061.75
S1 = 1041.50
R2 = 1065.25
S2 = 1038.25
R3 = 1068.50
S3 = 1035.00
numbers I'm using in the morning only
60.25
55 - 56
46 -49
38 - 39.50
33
60.25
55 - 56
46 -49
38 - 39.50
33
this 38 - 39 is top dog as it was a volume area from Fridays trade and now the O/N low is down there. The market will trade to where the old and new volume is......so all these numbers are the old volume...we need to monitor the day session NEW volume to help us get the direction right.....
I'm looking to fade this low for at least the 42 area this morning....
Other old volume is way down at the 24 - 26 area and the only other line is that 33 VWAP line for me..hopefully we won't be going down there yet today
I'm looking to fade this low for at least the 42 area this morning....
Other old volume is way down at the 24 - 26 area and the only other line is that 33 VWAP line for me..hopefully we won't be going down there yet today
seems like lots of Volume in this last 45 minutes before RTH...lets hope that translates into MUCH higher volume in Day session....
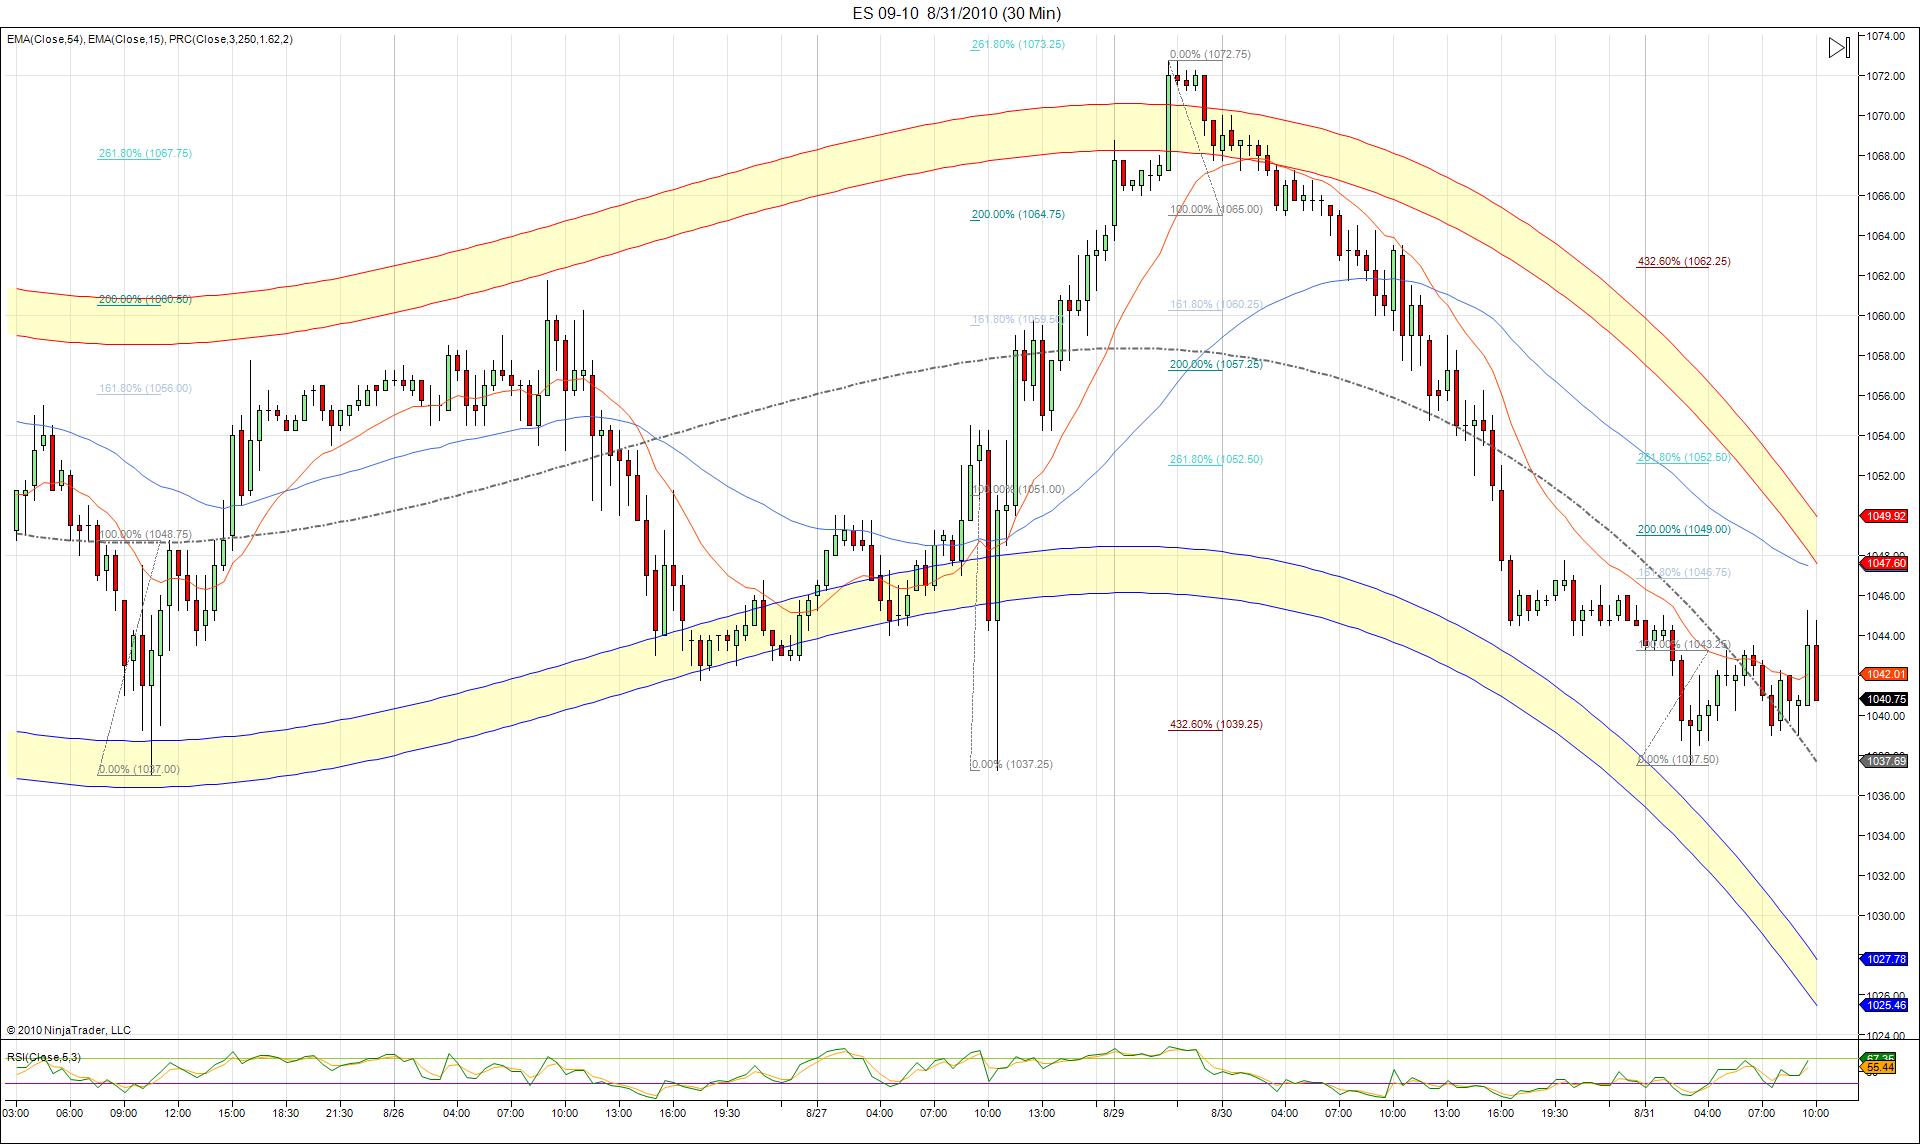
Just to confuse everyone here is 30min PRC with multiple fib projections.
Click image for original size
News at 9:45 and 10:00
for referenece . there is a gap at 52.50 from YD
interesting place on the chart...
5 day average of H vs Open comes in today at 50.25
Pivot 51 area
50% of the RTH week (so far) 51.25
5 day average of H vs Open comes in today at 50.25
Pivot 51 area
50% of the RTH week (so far) 51.25
1054.75 from Fridays wave up and 1055 from Mondays wave down are the 50% retraces and Resistance levels.
1050 a definite pivot point. 1053.25 about where the 50 ma of the 1 hour chart is.
Downtrend line from 1128 now at about 1161 here.
1050 a definite pivot point. 1053.25 about where the 50 ma of the 1 hour chart is.
Downtrend line from 1128 now at about 1161 here.
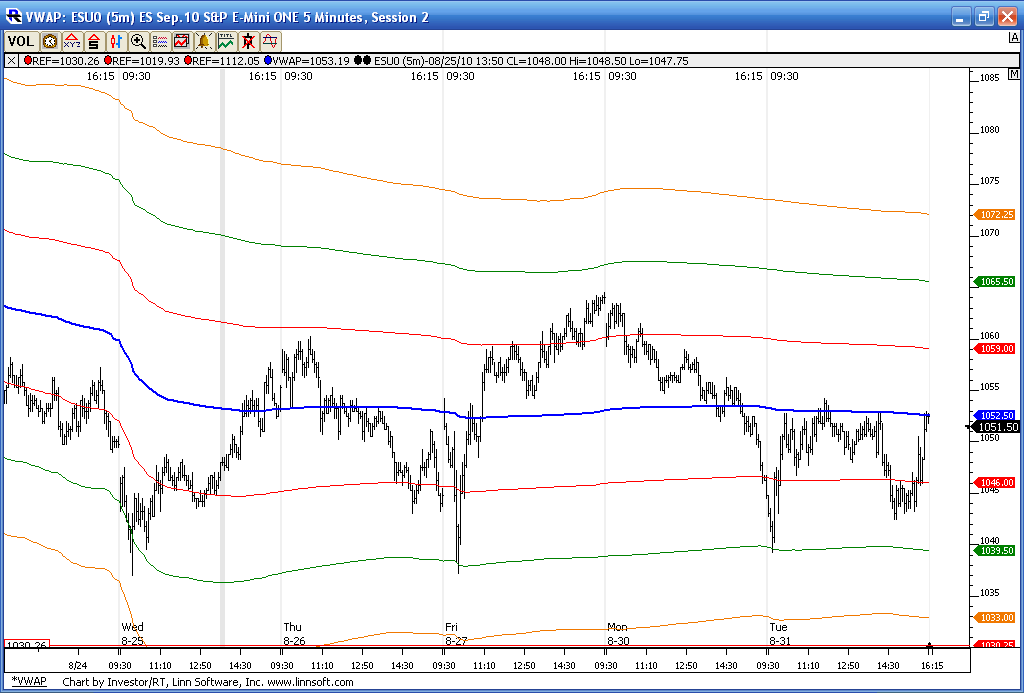
Here is VWAP from the last 7 days...Since we haven't extended beyond last weeks highs or lows...YET!!
Top 5 entry today and I wasn't here to take it..the break of hour highs into a resistance area...just pointing it out
Top 5 entry today and I wasn't here to take it..the break of hour highs into a resistance area...just pointing it out
Click image for original size
Emini Day Trading /
Daily Notes /
Forecast /
Economic Events /
Search /
Terms and Conditions /
Disclaimer /
Books /
Online Books /
Site Map /
Contact /
Privacy Policy /
Links /
About /
Day Trading Forum /
Investment Calculators /
Pivot Point Calculator /
Market Profile Generator /
Fibonacci Calculator /
Mailing List /
Advertise Here /
Articles /
Financial Terms /
Brokers /
Software /
Holidays /
Stock Split Calendar /
Mortgage Calculator /
Donate
Copyright © 2004-2023, MyPivots. All rights reserved.
Copyright © 2004-2023, MyPivots. All rights reserved.