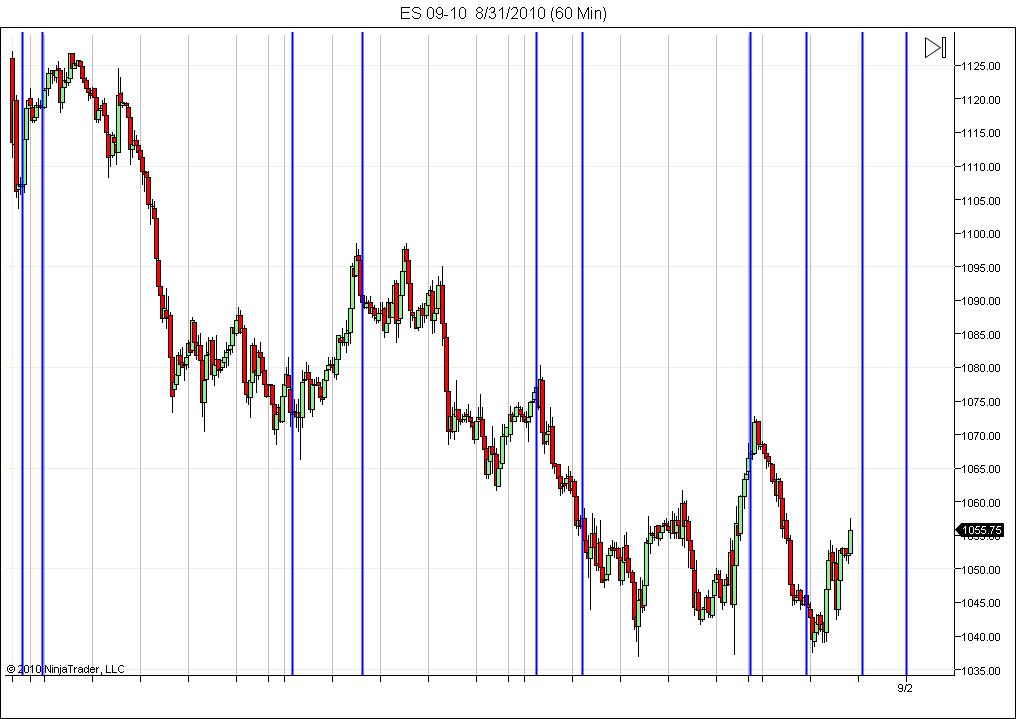
I'm just starting to try and understand timing. Gann dates have caught my interest and here are vertical lines near the highs and lows of the Ganns' permanent dates for August. The article and dates referenced were published in 1929.
(AUG 7/8th, 16/17th, 23/24th, 29/30th(minor importance)
For Sept-2/3rd,16/17th(should be bottom of a panicky decline),21-24th(a top), and 27/28th(bottom of a big break).
I'm just studying them for now but those are interesting coincidences to me.
Scroll the chart back for the 7/8th lines and values.
Please note I incorrectly placed a line on tomorrow, 1st of Sept.
DA
DavidS
Rep: 3,181
Posts: 557
please google "Gann 1929 forecast"
webtrading.com has the entire forecast article
sorry but I don't know how to post a link
webtrading.com has the entire forecast article
sorry but I don't know how to post a link
DA
DavidS
Rep: 3,181
Posts: 557
Thanks Lorn.
Originally posted by Lorn
http://www.webtrading.com/gannforecast.htm
There's the link.