ES weekend preview 3-19-11
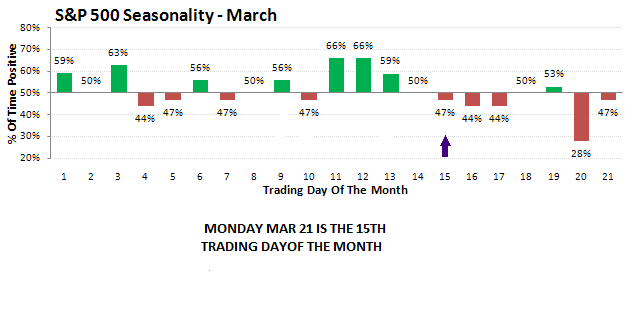
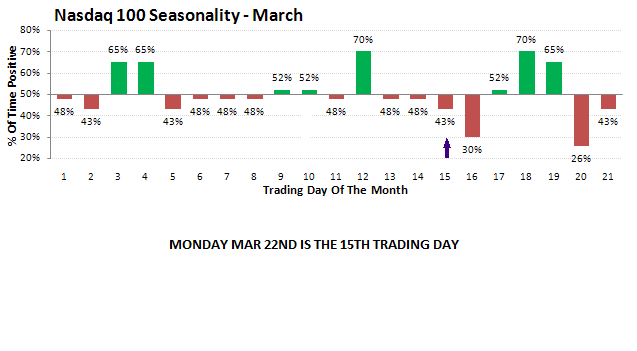
Shortly after the 'correction' started i showed how it needed to take the form of a zig-zag or triangle,since the last equivalent correction in Nov was a flat. A beautiful one has now been formed on the daily charts. Bulls are salivating, bears are ready to pounce! As usual, good arguments can be made for both views right now (that's what makes a market,right?).Last week, i tried to make the case for bullish seasonals calling for a rebound of sorts and after a high on the 16th as expected, we fell off into a low on Thurs. Now we have the opposite scenerio. Seasonals are strongly bearish , especially thru the 22nd, with a slight bullish bias on Thurs. We shall see...
Click image for original size
Click image for original size
Click image for original size
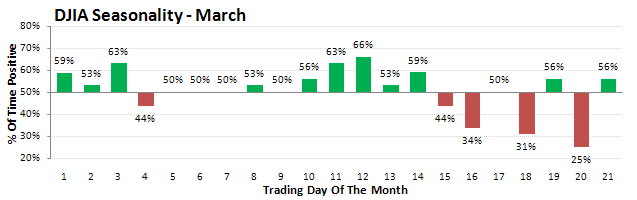
...Although there are slight differences in the indexes, a bearish bias can be seen Mon-Tues,giving way to a little bullish relief Thurs, and maybe Friday
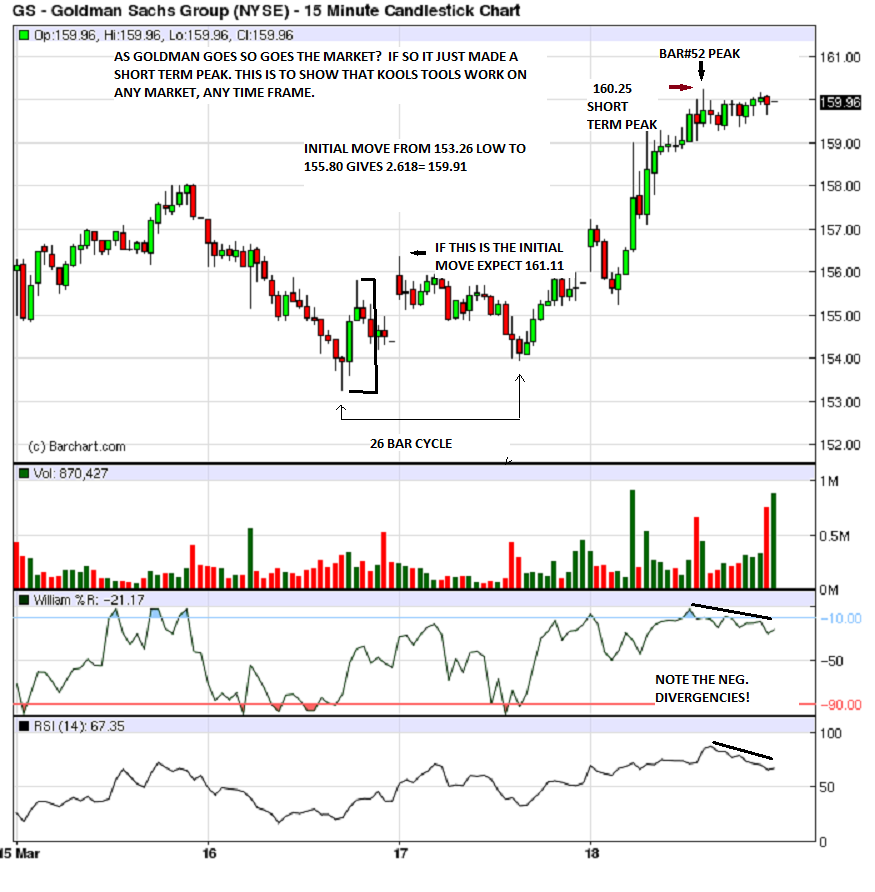
As always the purpose of this thread is not so much to 'predict' but to give you some ideas, for both bullish and bearish views so that you may form your own ideas!....First the bullish view
Click image for original size
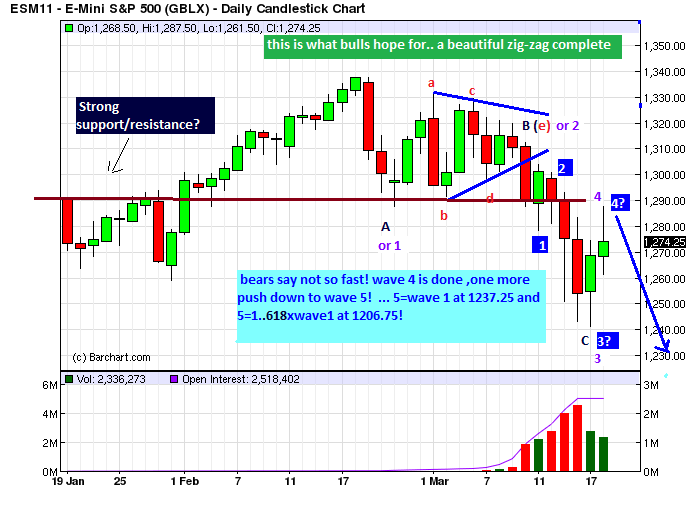
The uber bullish view is that the correction has indeed ended and that we now propel up strongly to at least 1315ish to finish the first wave one up. Supporting a generally bullish outlook are a) the kools tools turn point from 2/18 to 3/3 (using closing prices as is my custom) which called for a low on 3/16 ... very close as THE low came next day about 2 handles lower! Also at least 2 quantitative(statistical) studies which call for new rally highs by the 2nd week of April. And lets add numerous technical studies such as put-call ratios, several sentiment and tick-trin studies became extemely oversold last week. On the bearish side, (besides next weeks seasonals) we have Kools tools projections which have not yet been hit, overlapping waves up which is bearish ,not impulsive,and wave structures which allow for lower prices... Click image for original size
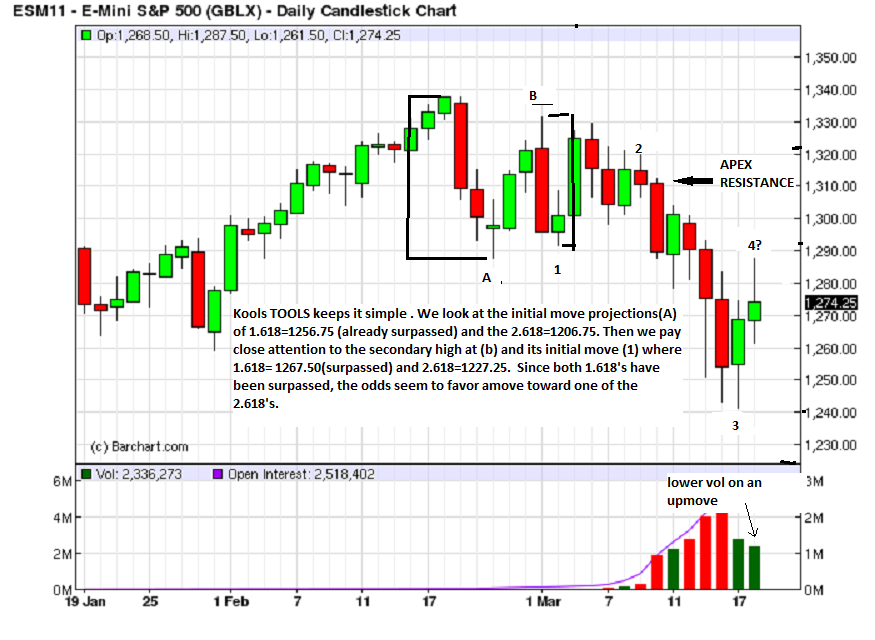
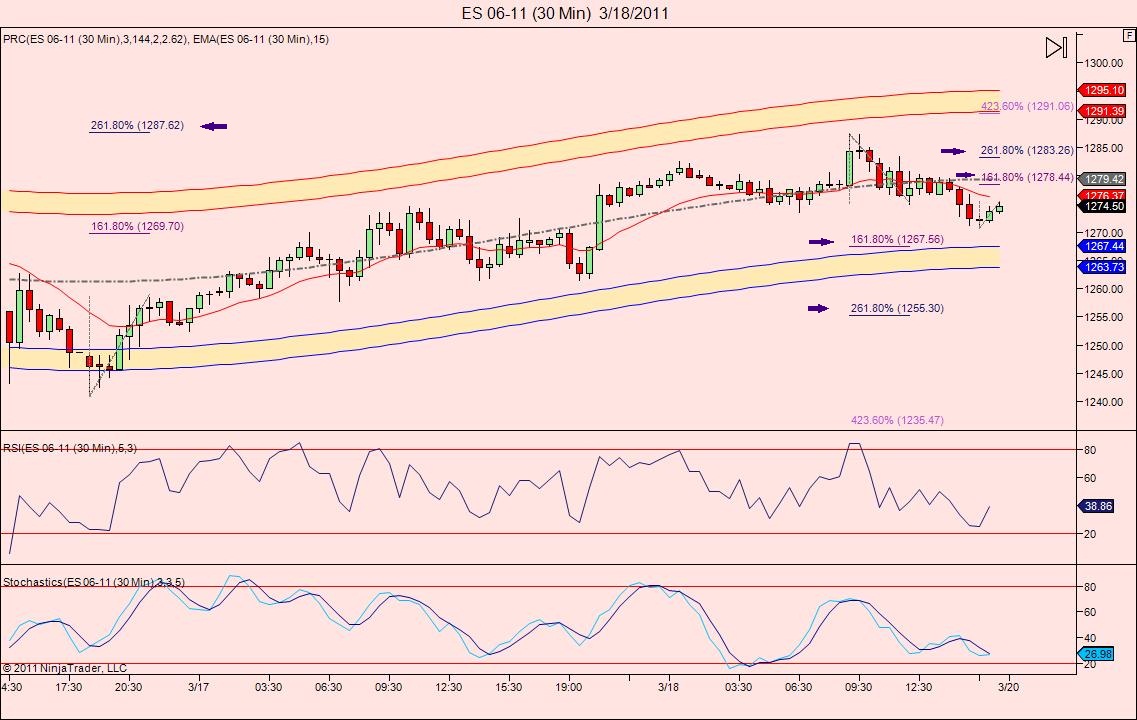
While i dont personally care much for the uber bullish view, i tend to be mildly bearish here and am waiting to see if an expected pullback early next week can achieve new lows or not. I do however still have a long term bullish bias in that i believe the 'yearly ' highs are in front of us. Heres a short term look at some numbers i was looking for as trading ended last week...
Click image for original size
Click image for original size
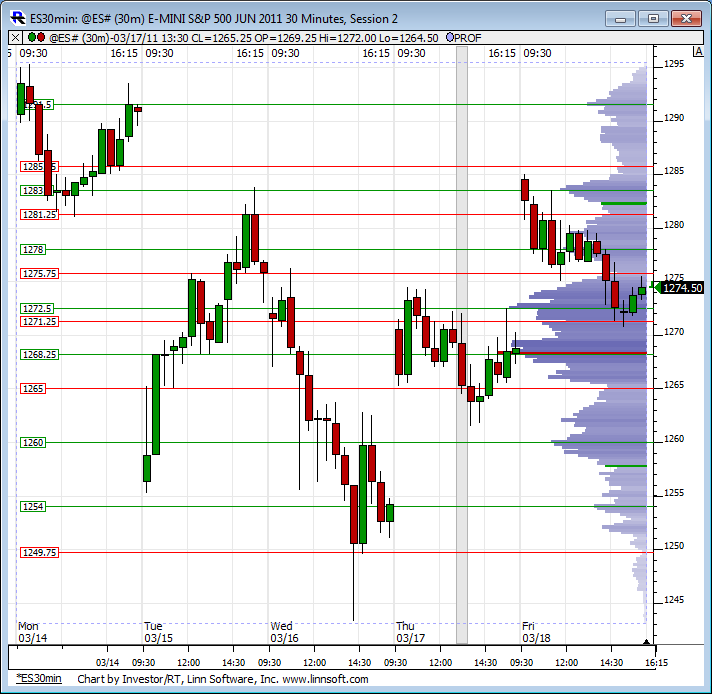
Here is last weeks RTH profile.
What strikes me as curious is out of the 5 gaps last week only 1 was filled on Wed.
What strikes me as curious is out of the 5 gaps last week only 1 was filled on Wed.
Click image for original size
Emini Day Trading /
Daily Notes /
Forecast /
Economic Events /
Search /
Terms and Conditions /
Disclaimer /
Books /
Online Books /
Site Map /
Contact /
Privacy Policy /
Links /
About /
Day Trading Forum /
Investment Calculators /
Pivot Point Calculator /
Market Profile Generator /
Fibonacci Calculator /
Mailing List /
Advertise Here /
Articles /
Financial Terms /
Brokers /
Software /
Holidays /
Stock Split Calendar /
Mortgage Calculator /
Donate
Copyright © 2004-2023, MyPivots. All rights reserved.
Copyright © 2004-2023, MyPivots. All rights reserved.