JI
jimkane
Rep: 3,058
Posts: 33,089
For those wanting to look at longer-term things (I've gotten a few requests), take a look at copper (basis HG #F). I have two areas, one at 79-91, and one at 54-63. You can pinpoint these a little tighter once you do the work (and as it gets closer and the lines better define the area), but that's the range of all the key factors I'm looking at. The first area is an ABCD, the second is the 'blown' ABCD, or overextended 1.618 ABCD, for those that see that as an ABCD (I don't). Both areas are very nice confluences with key factors. This is a weekly traded timeframe setup, if one thinks copper will start going back up i.e. 'risk on', and China is still an immediate powerhouse. If we are done with 'risk on' for awhile, this likely won't do much with those areas. It has now hit the upper part of the upper area, but the lines are still below.
JI
jimkane
Rep: 3,058
Posts: 33,089
Now that copper is moving up, there are two key areas I'm watching. I'll round them for ease of posting. 400 (here), and 410. Both are significant, but 410 is probably more key. These areas may give me clues as to whether this is moving off the early part of the higher area, or is just bouncing for a roll deeper down.
JI
jimkane
Rep: 3,058
Posts: 33,089
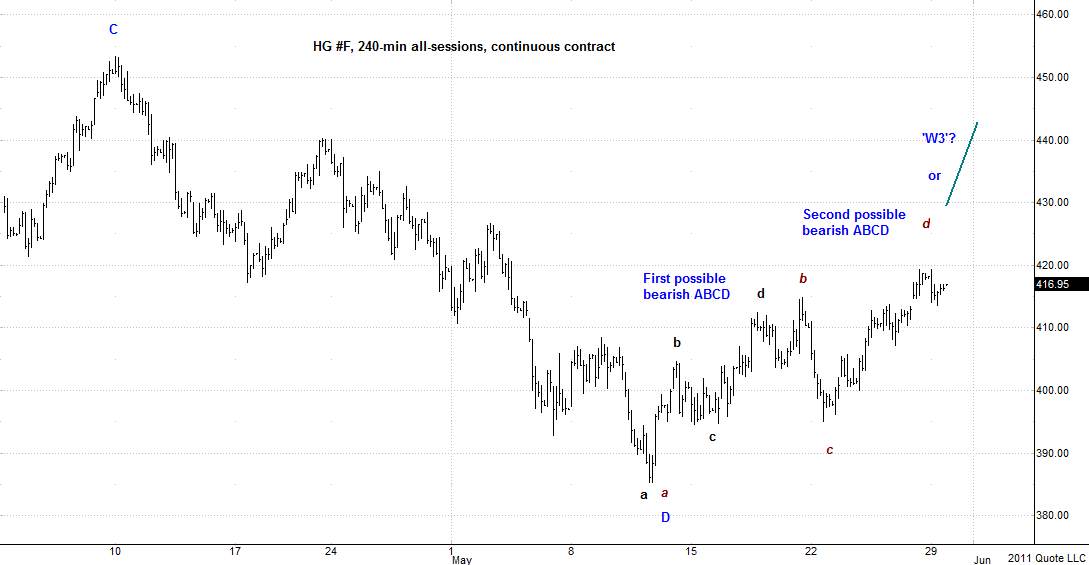
Copper has moved up nicely, but notice this bearish ABCD into the first area mentioned above. Time for me to pay close attention and see how it acts. This is a huge bullish pattern, so if it holds any sway this should really get moving up. It wouldn't be a good sign to have this roll off an ABCD. But, perhaps, it wants to go to the lower area mentioned in the first post, and it could use this pattern to do it. Or, it may just keep going down... That's the fun of trading, all the possibilities to contend with.
JI
jimkane
Rep: 3,058
Posts: 33,089
Is everyone following this? Copper still rising. I'll try to post an update with some details this weekend.
JI
jimkane
Rep: 3,058
Posts: 33,089
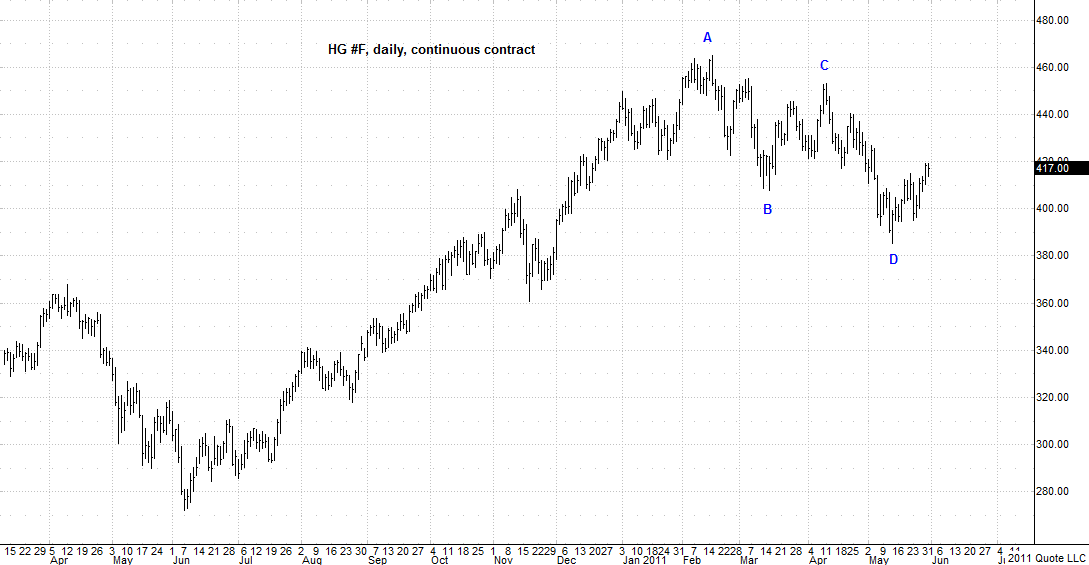
Here's my update. Do your own work. Pu together the full setup. Find all the areas on the way up. Look where the .382's and .447's are, and all the lines. Here's the framework. Now all I can do is see if it keeps rising. I can find the setups, and if I take them, see how they act, what unfolds, and decide on a management plan. I can look for warnings and clues, and use those in my management decisions. It's a lot more about how the trade is handled/managed, in my opinion, that how 'good' the PTA is. The PTA is perhaps 10%-20% of my 'Trading Plan'.
Charts courtesy QCharts.
Click image for original size
Click image for original size
Charts courtesy QCharts.