The original article can be reached by going here:
http://www.sfomag.com/articledetail.asp?ID=813877111&MonthNameID=February&YearID=2005
Is The VIX Dead? Tweak the Parameters for Better Signals
by: Christopher P. Hendrix, CMT
No, it’s not dead. Adding Bollinger Bands into the mix breathes new life into volatility indicators, propelling them to the forefront of one’s technical analysis arsenal.
[Editor’s note: While some have pointed to the extremely low readings in the VIX over the last year or so as evidence that the indicator no longer “works,” technical analyst Chris Hendrix presents a new way of using this tool. In this article, he outlines a method using Bollinger bands and redefines “extreme” readings in order to gauge buy and sell signals across multiple timeframes.]
Investor psychology is often referred to as the battle between the emotions of fear and greed. The Chicago Board Options Exchange’s Volatility Index (VIX) attempts to display the ebb and flow of these emotions. This battle has recently moved beyond the scope of the indicator to the indicator itself as many have announced the death of the VIX’s predictive value, while others believe the historically low readings warn of an impending doom and gloom scenario in the U.S. equities market.
However, there is another way to look at the VIX. This article describes a simple yet effective twist using the VIX and other volatility measures that can break through the controversy to arrive at buy and sell signals for both day traders to longer-term trend followers.
First…Some Background
The CBOE Volatility Index (VIX) was developed in 1993 for the CBOE by Robert E. Whaley, a professor at Duke University. The CBOE has been posting the VIX values since that year, though the values have been back-calculated and are available going back to January 1986. The VIX had been tied to the implied volatility of S&P 100 Index (OEX) options, but a fairly recent change has the indicator based on a basket of S&P 500 Index (SPX) options. An average is taken of the implied volatility numbers from the basket, simulating an option with approximately 30 calendar days until expiration.
How It Works
During equity price declines, emotion increases its influence over rational decisions as investors become more fearful. To offset potential losses, investors often head toward the options market to hedge their positions. Others attempt to take advantage of the increase in choppy market action by speculating in the options market. The choppy market increases the difficulty in accounting for the option’s most likely landing area 30 days out. The increase in uncertainty causes an increase in the implied volatility portion of the option’s price. Extreme feelings of impending doom and also of “pie-in-the-sky” optimism are commonly experienced by all market participants, novice and experienced, professional and non-professional.
Traders generally use the VIX and its measures of extremes as a contrary indicator. Contrary analysis often is viewed in terms of herd mentality, and an increasing level of investor herd mentality can push a stock or index quickly higher or lower. Of course, when the sentiment of investors reaches an extreme, the bullish buying power may be depleted or the bearish selling exhausted, causing the move to stop and reverse.
An investor who painfully cries, “The market couldn’t be worse,” or gleefully exclaims, “The market couldn’t be better,” should listen to his own words. A market that could not be worse theoretically would then move higher with the opposite also being true.
For those readers who are unfamiliar with the signals, a declining VIX usually occurs during times of growing bullishness, and a rising VIX reading is seen during bearish trends. Because the VIX is used as a contrary indicator, a low VIX reading would be seen as a sell signal, while a high VIX reading traditionally would be viewed as a buy signal.
Good Historical Readings
Horizontal lines have been added to Figure 1 at the 20 and 35 levels in the VIX section of the chart. These two levels historically have marked reasonably well the psychological extremes. Over 35 has signified the extremes in fear and, therefore, a reversion back toward a balance (between 20 and 35) tends to follow. Readers can see that the upside VIX extremes tended to match reasonably well with bottoms of the SPX, and downside VIX extremes tended to match with SPX tops from early 1998 through early 2003.
Click image for original size
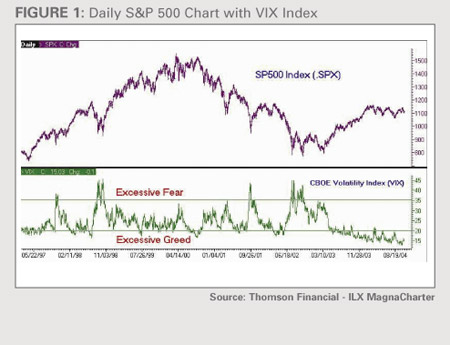
Because of the historical precedents, investors have fixated on these two levels: 20 and 35. But perhaps this is why many today have questioned whether the VIX actually works any more.
So what’s been happening lately? Notice that the VIX has been below the 20 level since early 2003, and while minor price dips were seen, corrections were not strong enough to label the indicator as being valuable. Not pictured is that the VIX stayed below the 20 level for an overwhelming majority of the time from mid-1991 through mid-1997 as the SPX gained significant ground.
Redefining the Extremes
The line in the sand appears to have been drawn with one side of the trading and technical community stating that the low VIX has not been correctly foretelling market declines, while others advise patience and caution, warning of an impending major decline in U.S. equities. Instead of joining either side of the camp on the VIX controversy, the valid points of both sides can be combined to form a strategic indicator that gives defined signals. The concept of high implied volatility at market lows appears valid; low volatility at market highs also appears valid. The extremes simply need to be redefined and have the ability to adjust to varying market conditions. High volatility and low volatility are terms that need to be relative to recent price action.
Bollinger bands, developed by John Bollinger, CFA, CMT, is a wonderful tool for defining “relative” highs and lows of an indicator or price. With the common setting of two standard deviations from a simple 20-period moving average, 95 percent of the data should fall inside the bands. Therefore, the remaining five percent are times of extremes, displayed by data outside the bands.
Buy and Sell Signals
I display the VIX as a line chart (close or last) in Figure 2. A close outside of the bands is considered the setup, and a close back inside the band is the ideal signal. During a sharply rising or falling market, the VIX may close outside of the bands for several sessions in a row, so assuming a market turn while the VIX is in setup mode can be dangerous. Keep in mind that upside VIX extremes mark an overabundance of fear, so a close above the upper Bollinger band is the setup for a buy signal. Conversely, VIX extremes to the downside note a high degree of greed and complacency, so a close below the lower Bollinger band sets up the sell signal.
Click image for original size
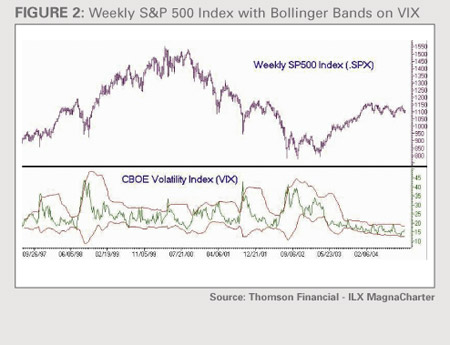
This method can be used across many timeframes from intraday charts to monthly-based charts. The weekly-based VIX chart seen in Figure 2 displays numerous instances of high and low relative extremes. Weekly-based signals tend to precede rallies and declines lasting approximately four to six weeks. It is important to recognize that market movements beginning with signals do not necessarily continue until the opposite signal is given, so consider this method “entry only.”
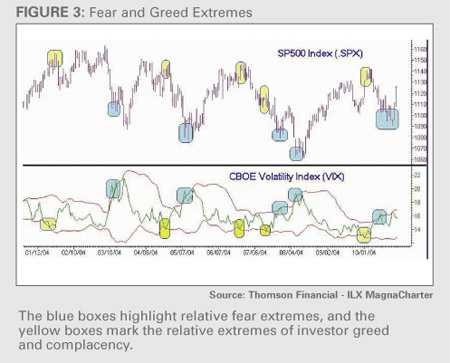
Let’s take a look at recent price action. Into late 2004 (as of December at this writing), equity market action has been very choppy. The low VIX readings have triggered speculation among many traders and analysts that almost every price retreat was the beginning of a major decline to correct the high degree of greed and complacency. The anticipated market meltdowns did not occur, and that prompted many to throw out the VIX as a useful indicator. In Figure 3, however, the usefulness of the daily VIX during 2004 is seen as the Bollinger bands marked the relative extremes. The S&P 500 broke to a new low for the pattern in May and again in August. However, the relative VIX extreme (setup and signal) should have led to the assumption that SPX was likely to rebound versus accelerate lower. No indicator has a perfect record, and this method did not mark all the highs and lows, but the accuracy of the indicator is high enough that it is the first one I check each day.
Click image for original size
Works on an Intraday Basis Too
The method holds its value even when tightening the focus to intraday charts. Figure 4 displays the 15-minute VIX from October 18, 2004, to October 22, 2004. Signals tend to have implications of moves lasting multiple hours. Again, not all highs and lows are signaled by this method, but when they are visible, the signals warrant attention. Some signals result in a stall pattern rather than trend reversals, but a simple addition may filter some of the less common nuisance signals.
Click image for original size
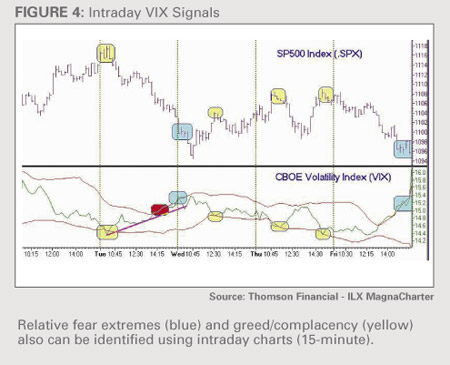
Once a signal is alerted, draw a trendline on the VIX from the last swing low during a rising VIX or swing high if the VIX has been declining. The red highlight marks a signal that hardly even stalled the market. In this case, another VIX high extreme was alerted, but that is not always the case. The trendline – inserted following the red highlighted signal – was subsequently broken and coincided with the swing low. The trendline method could be added following most signals. Accuracy may improve, but perhaps with the tradeoff of a slight lag in entry.
Combine the VIX with Other Tools
Individual indicators rarely should be used as stand-alone systems. Granted, I put a high weighting on the volatility signals of this method, but as mentioned earlier, some market turns occur without volatility extremes. Therefore, I prefer to monitor the Money Flow Index (MFI) and Moving Average Convergence Divergence (MACD), or the hybrid “MFI-MACD” of the corresponding timeframe. (See related article in the November 2003 SFO: “One Plus One Can Equal Three – Signal Divergences Faster by Combining Powerful Indicators.”) Traditional signals from these indicators while the VIX is near an extreme may suffice to take action.
The method is not limited to the CBOE Volatility Index (VIX). The VXO is also known as the “old VIX,” as its formula is based on the S&P 100 Index options (the original formula for the VIX). The VXN is the volatility measure based on the NASDAQ 100 Index options and is similar to the QQV, based on the options related to the NASDAQ 100 Index Tracking Stock (QQQ).
Once armed with the most likely path of the underlying vehicle (e.g., S&P 500 for the VIX), a trading vehicle can be chosen. Some may choose the options of the underlying or trade in the corresponding exchange traded fund (ETF).
Those familiar with the nuances of option trading should recognize that this method favors put buying versus call buying as a low volatility level that begins to climb during a falling market can leverage the long put position. Decreasing volatility in a rising market environment may cause the long call position to increase at a slower rate. Investors also may choose to use this method to simply increase market feel while looking to trade individual stocks in the corresponding direction. This assumption, however, runs the risk that the stock chosen as a trading vehicle may not move in line with the security tied to the volatility index.
Take a Fresh View
Indicators and methodologies need to evolve. The argument that the VIX is unreliable is only correct in that its traditional extremes may no longer be useful. Those on the other side, warning of over-optimism and an impending major correction, also may be correct some time in the future. However, opportunity costs are too great for many investors to be bearish during multiweek to multimonth rallies while waiting for a price breakdown. Adding Bollinger bands into the mix breathes new life into the volatility indicators and could propel them to the forefront of one’s technical analysis arsenal.