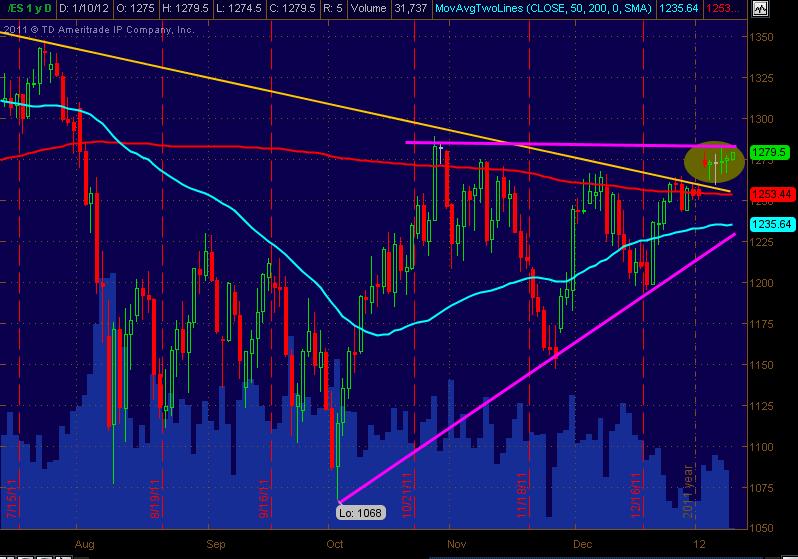
ES - Daily Overall Look
Tight sideways overlapping daily bars for a week now.
It’s up against the LINE of the ascending triangle drawn in Magenta.
It’s also punched above the Yellow down trend line that it came back and tested.
It’s above the 50 and 200 SMAs as well now.
No significant pullback on the move up since 12/20 = “strength.”
Looking like a significant move out of this area … my view, based on above analysis and intraday action has me leaning towards a breakout UP.
Just wanted to toss this out there. Here’s the ES Daily chart that everyone also has on their radar:
I'd alluded to this in the past day or two. We'll see I guess.
It’s up against the LINE of the ascending triangle drawn in Magenta.
It’s also punched above the Yellow down trend line that it came back and tested.
It’s above the 50 and 200 SMAs as well now.
No significant pullback on the move up since 12/20 = “strength.”
Looking like a significant move out of this area … my view, based on above analysis and intraday action has me leaning towards a breakout UP.
Just wanted to toss this out there. Here’s the ES Daily chart that everyone also has on their radar:
Click image for original size
I'd alluded to this in the past day or two. We'll see I guess.
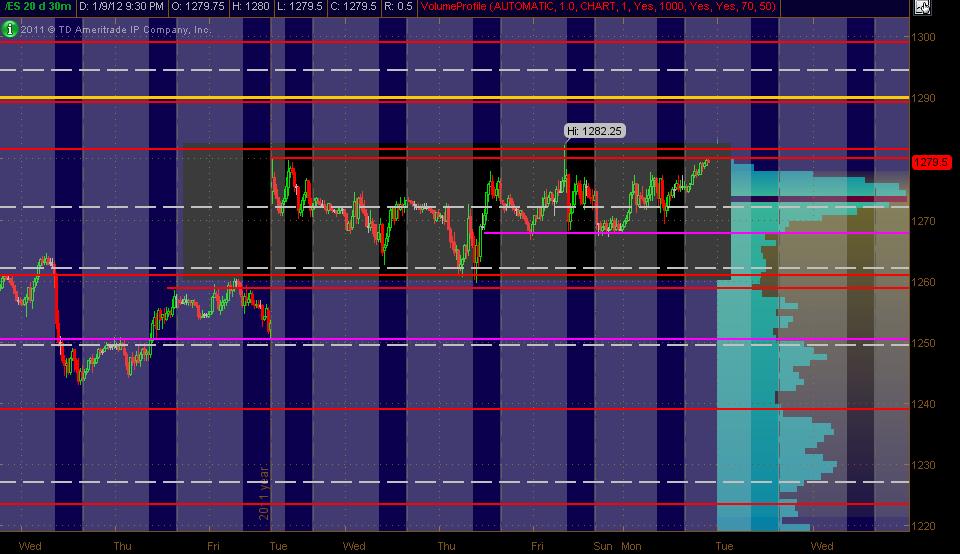
Here's an All Trading Hours 30min chart showing the narrow/constriction of price action highlighted in Black. Just a drill-down into what I described with the ES daily chart and the commentary:
MM
Click image for original size
MM
overnight went right to your red/yellow brick wall at 1290
excellent work MM !
I expect we will back and fill a bit this morning off that resistance level
Just curious why you put the lines at 1290'ish ?
excellent work MM !
I expect we will back and fill a bit this morning off that resistance level
Just curious why you put the lines at 1290'ish ?
Originally posted by pt_emini
Just curious why you put the lines at 1290'ish ?
Nothing too exotic really.
Using an All Trading Hours ES continuous contract daily chart, I eyeballed a best fit line primarily taking into account these days/swings for the Red S/R level:
4-18-11 swing low of 1290.25
6-21-11 swing high of 1293.75 (prior day’s high was 1292.75)
7-18-11 swing low of 1291.25
10-27-11 swing high of 1289.25
(I guess a pic of the chart would offer a better “visual” and more nuances I could point out)
As for the Yellow line … I used the 30min chart mostly (all trading hours) looking for any potential Fib extension/retracement clustering that stood out to me … and was also very near a Red S/R level. And 90’s also a decent round number. All taken together, the 1290 area stood out to me as a pretty significant level to watch.
Still struggling with how heavily to weight RTH vs ATH price highs and lows. Also, I’m assuming most other folks are working off of continuous contracts by now. Granted, the cash index would look a little different. But most of the PASR levels I find are using the current front month ES contract using the 30min chart. Obviously 1290 was going back a bit further – multiple months.
Emini Day Trading /
Daily Notes /
Forecast /
Economic Events /
Search /
Terms and Conditions /
Disclaimer /
Books /
Online Books /
Site Map /
Contact /
Privacy Policy /
Links /
About /
Day Trading Forum /
Investment Calculators /
Pivot Point Calculator /
Market Profile Generator /
Fibonacci Calculator /
Mailing List /
Advertise Here /
Articles /
Financial Terms /
Brokers /
Software /
Holidays /
Stock Split Calendar /
Mortgage Calculator /
Donate
Copyright © 2004-2023, MyPivots. All rights reserved.
Copyright © 2004-2023, MyPivots. All rights reserved.