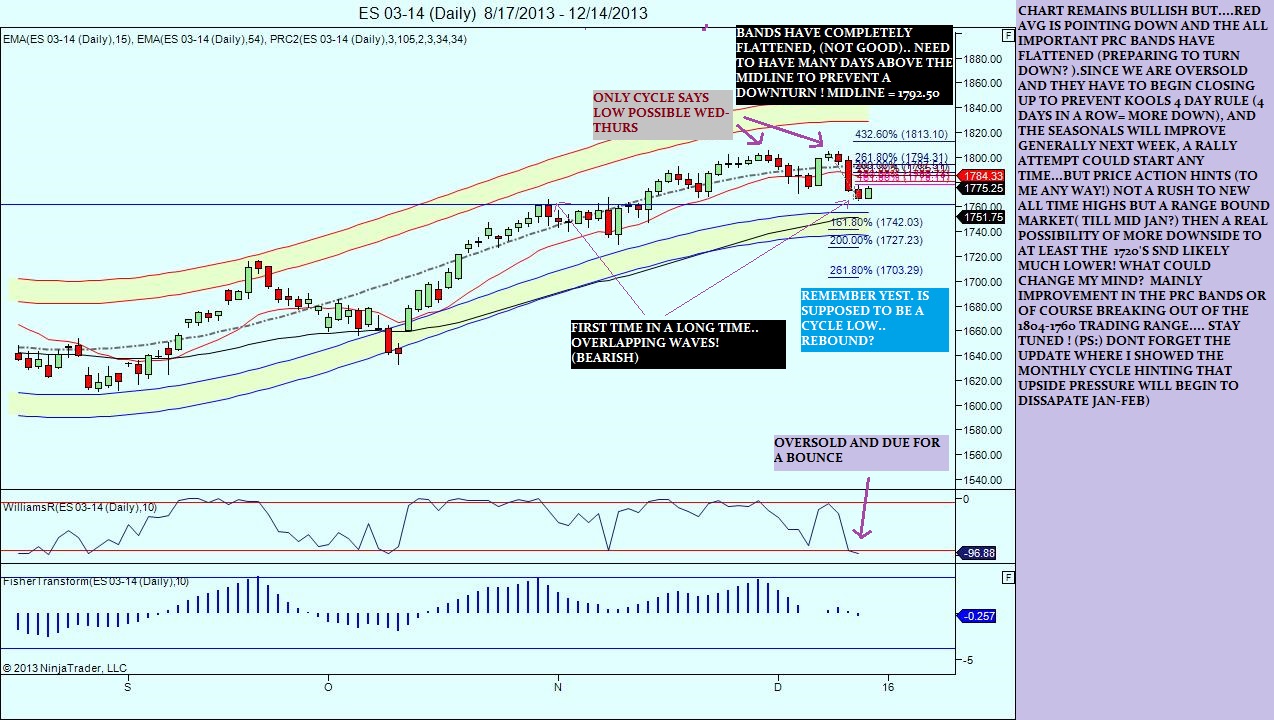
ES End of the week update .. Friday the 13th !!
Maybe we go past equality (short term 1765.50) and grab that 1760-62 or try to rally now...no idea but dont get complacent on the late Dec rally , when ever it comes! I think things could potentially get ugly in Jan...just my opinion,fwiw
Click image for original size
..
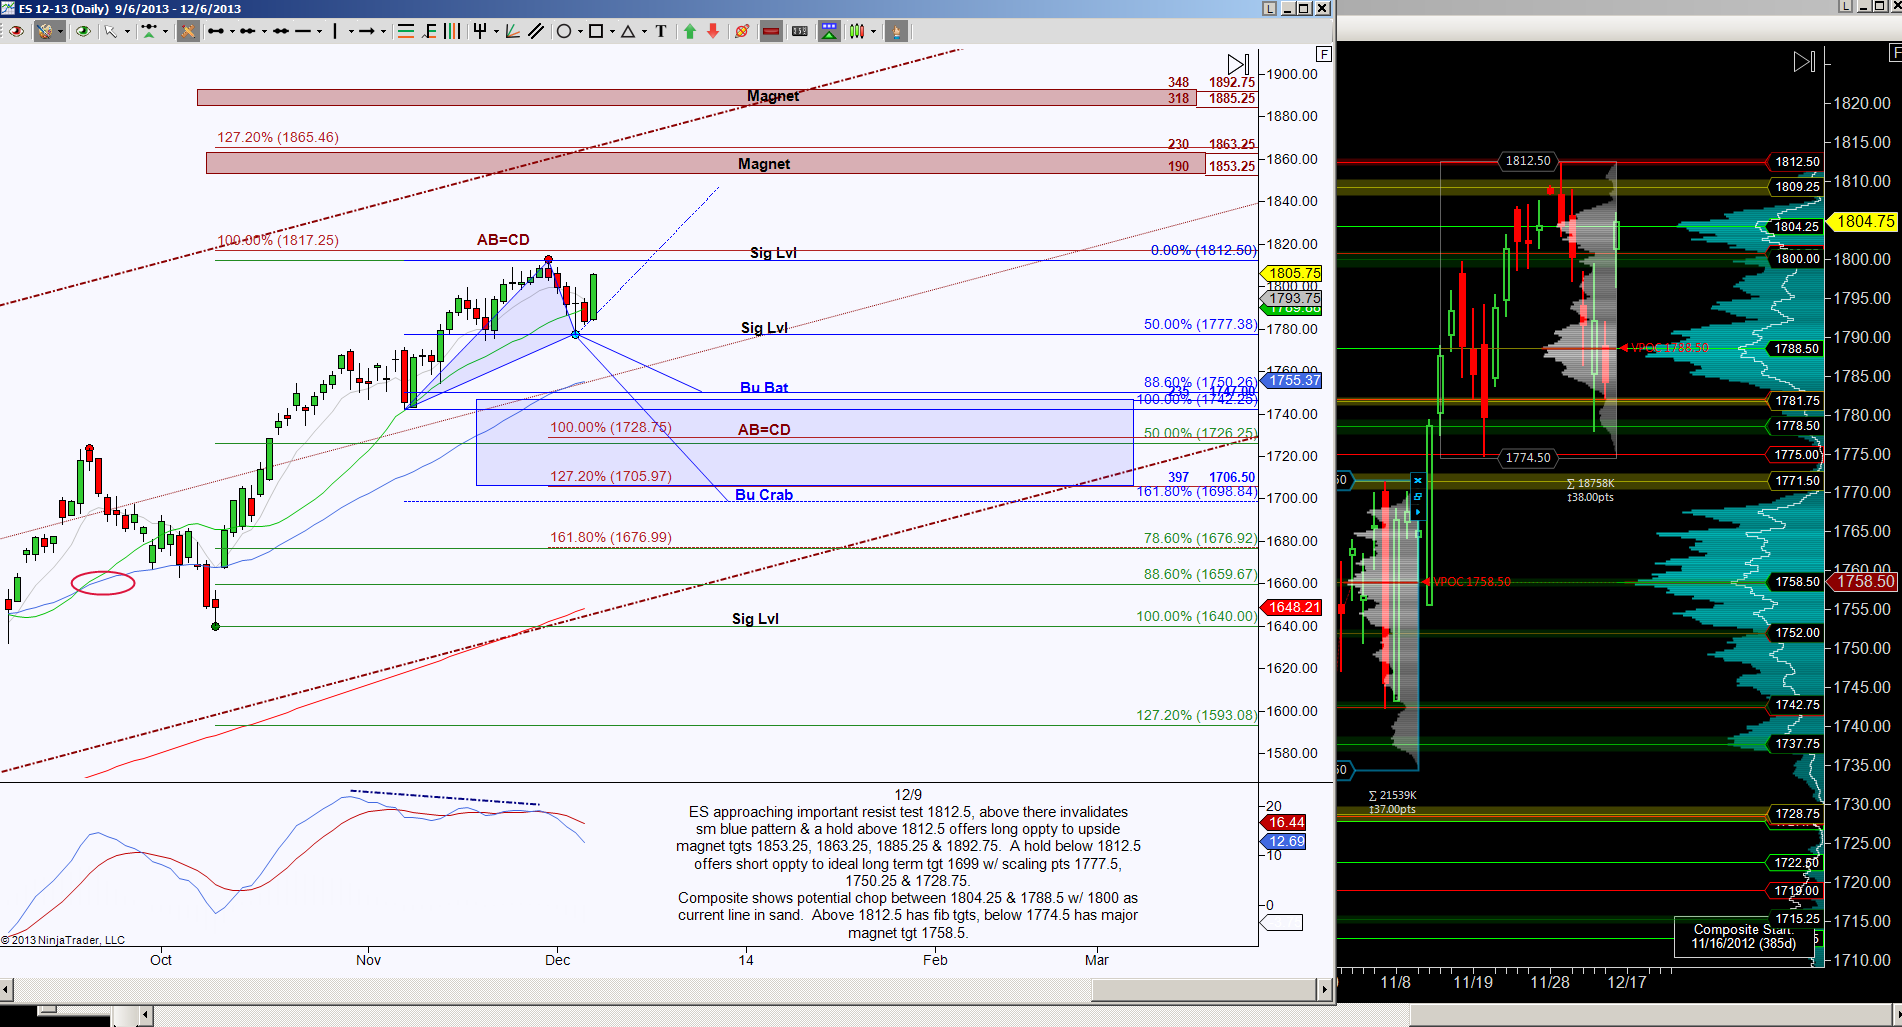
And for my ES friends , an interesting look from a harmonic and vol profile look from Kathy Garner, one of the few analysts i respect..(. be advised its basis the Dec contract, so now it would basically reflect the cash index)
Click image for original size
Oops , i meant G arber!.. and from Cobra (for next weeks action)...12/16: OE Monday, SPX up 8 of 12
12/18: FOMC
12/20: OE Friday, SPX up 22 of 30
Dec OE Week, SPX up 22 of 28
12/18: FOMC
12/20: OE Friday, SPX up 22 of 30
Dec OE Week, SPX up 22 of 28
Hey Monkey, check this out.. its a study of just Dec expiration week!..
I have already shown how interpet seasonals in past updates,but here is an interesting study for the week of DEC expiration courtesy of Ned Davis research: Enjoy S&P 500 Cash | NASDAQ Composite
Expiration Study for December:
Average % Changes For S&P 500 Cash
Total Months Tested For Daily Stats: 29
Study Expiration Date Range : 12/21/1984 - 12/21/2012
Overall Expiration Date Range: 1/20/1984 - 11/15/2013
DAILY STATS
Day (Period) Geo Avg Ari Avg Median Num Up Num Dn Total
-------------- -------- -------- -------- ------ ------ ------
PreviousFriday 0.23662 0.23929 0.27353 19 10 29
Monday 0.18411 0.18974 0.22698 17 12 29
Tuesday 0.43144 0.43865 0.25187 17 12 29
Wednesday -0.05486 -0.05226 -0.07654 14 15 29
Thursday -0.11352 -0.10902 -0.14143 13 16 29
Exp. Friday 0.32290 0.32688 0.41702 20 9 29
PrevFri-Mon 0.42116 0.42931 0.50493 21 8 29
Day AfterExp -0.02613 -0.02175 -0.11364 13 16 29
WEEKLY STATS
Period Geo Avg Ari Avg Median Num Up Num Dn Total
-------------- -------- -------- -------- ------ ------ ------
Study Exp Week 0.77134 0.78568 0.70491 23 6 29
All Exp Week 0.29429 0.32281 0.57187 215 144 359
NonExpire 0.11037 0.13679 0.24132 669 529 1198
All Weeks 0.15274 0.17968 0.31185 884 673 1557 8-)
Hard to read , but i just look at numbers up and numbers down... ie: Thurs weak cause 13 days up versus 16 days down..
Click image for original size
Click image for original size
...
Emini Day Trading /
Daily Notes /
Forecast /
Economic Events /
Search /
Terms and Conditions /
Disclaimer /
Books /
Online Books /
Site Map /
Contact /
Privacy Policy /
Links /
About /
Day Trading Forum /
Investment Calculators /
Pivot Point Calculator /
Market Profile Generator /
Fibonacci Calculator /
Mailing List /
Advertise Here /
Articles /
Financial Terms /
Brokers /
Software /
Holidays /
Stock Split Calendar /
Mortgage Calculator /
Donate
Copyright © 2004-2023, MyPivots. All rights reserved.
Copyright © 2004-2023, MyPivots. All rights reserved.