22 Feb 2005
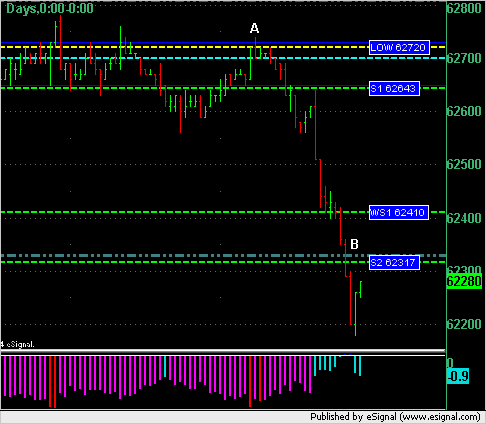
The trade shown in this chart is an ER2 short based on key S/R levels and an indicator called alpha that was showing weakness. The short was taken at point A and closed out at point B.
Click image for original size
No trades posted yet. It is anticipated that trades made in real time and posted in the #emini trading room could be kept online in this trade journal as a means of explaining why a trade was taken.
Trading notes for 22 Feb 2005
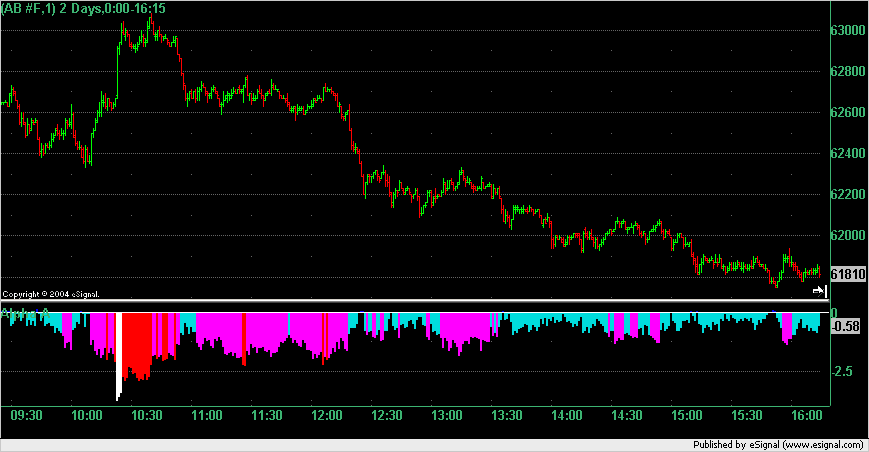
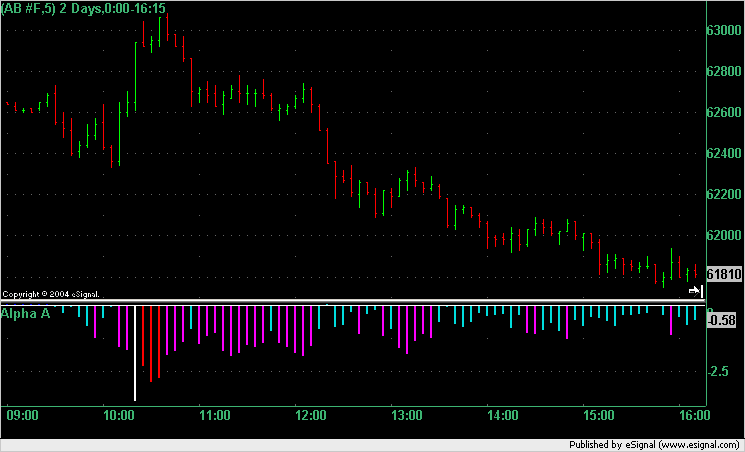
Charts for ER2 for 22 Feb 2005. First chart is 1 minute chart and second is 5 minute chart. Both charts show just 1 indicator which is the "Alpha A" indicator. This indicator gave a permanent sell signal all day long with the peak strength of the sell signal just before the high of day.
Charts for ER2 for 22 Feb 2005. First chart is 1 minute chart and second is 5 minute chart. Both charts show just 1 indicator which is the "Alpha A" indicator. This indicator gave a permanent sell signal all day long with the peak strength of the sell signal just before the high of day.
Click image for original size
Click image for original size
Emini Day Trading /
Daily Notes /
Forecast /
Economic Events /
Search /
Terms and Conditions /
Disclaimer /
Books /
Online Books /
Site Map /
Contact /
Privacy Policy /
Links /
About /
Day Trading Forum /
Investment Calculators /
Pivot Point Calculator /
Market Profile Generator /
Fibonacci Calculator /
Mailing List /
Advertise Here /
Articles /
Financial Terms /
Brokers /
Software /
Holidays /
Stock Split Calendar /
Mortgage Calculator /
Donate
Copyright © 2004-2023, MyPivots. All rights reserved.
Copyright © 2004-2023, MyPivots. All rights reserved.