ES Weekend update 1/10/2014
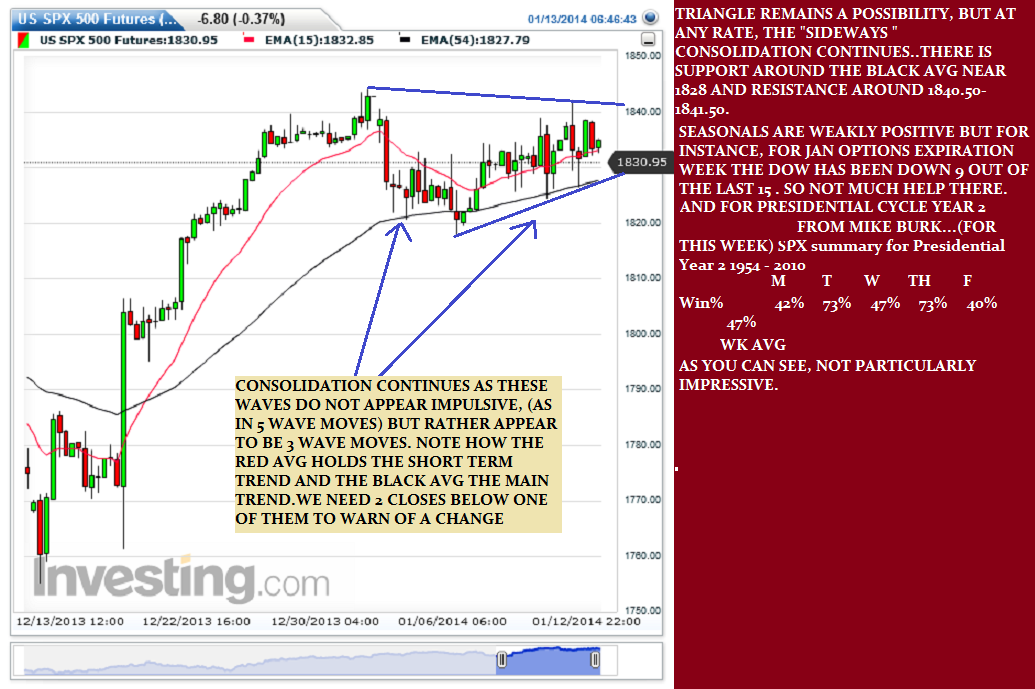
well on the 5 hour chart you've seen that a triangle may be forming..time will tell, but here's a look at the state of the markets as i see it:
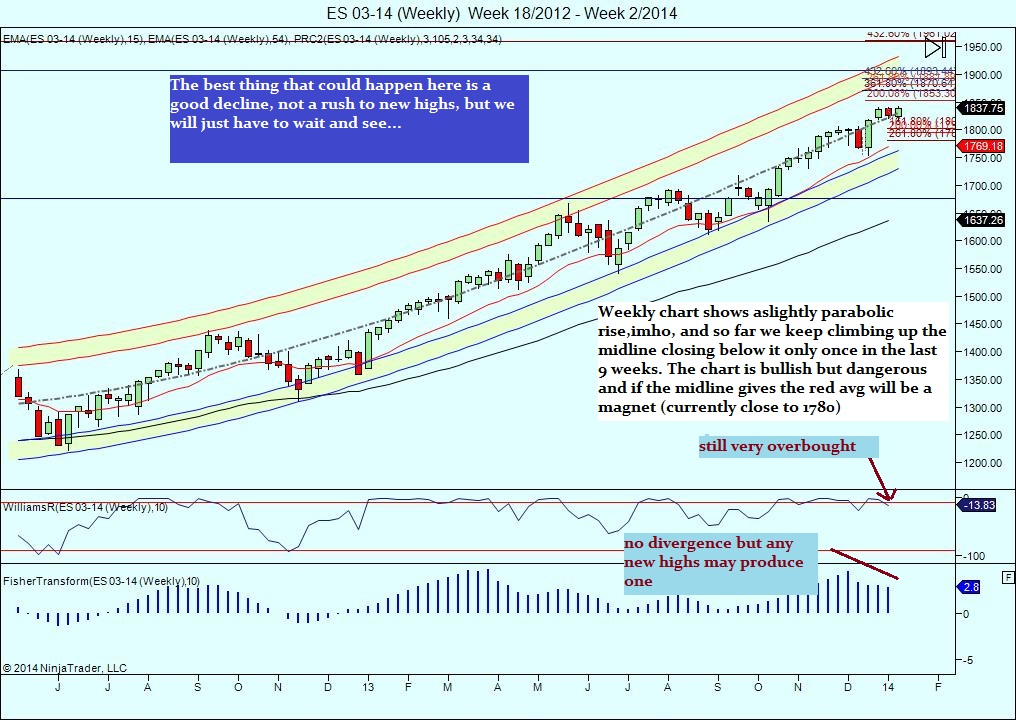
I had the 9th as a low and at least so far that was spot on .. but if we turn down now it may give a good low coming in about two weeks ... Seasonals are now up ,but weakly. .The bands are flat and ready to bend either way now. This week should resolve a lot of questions!
Click image for original size
Click image for original size
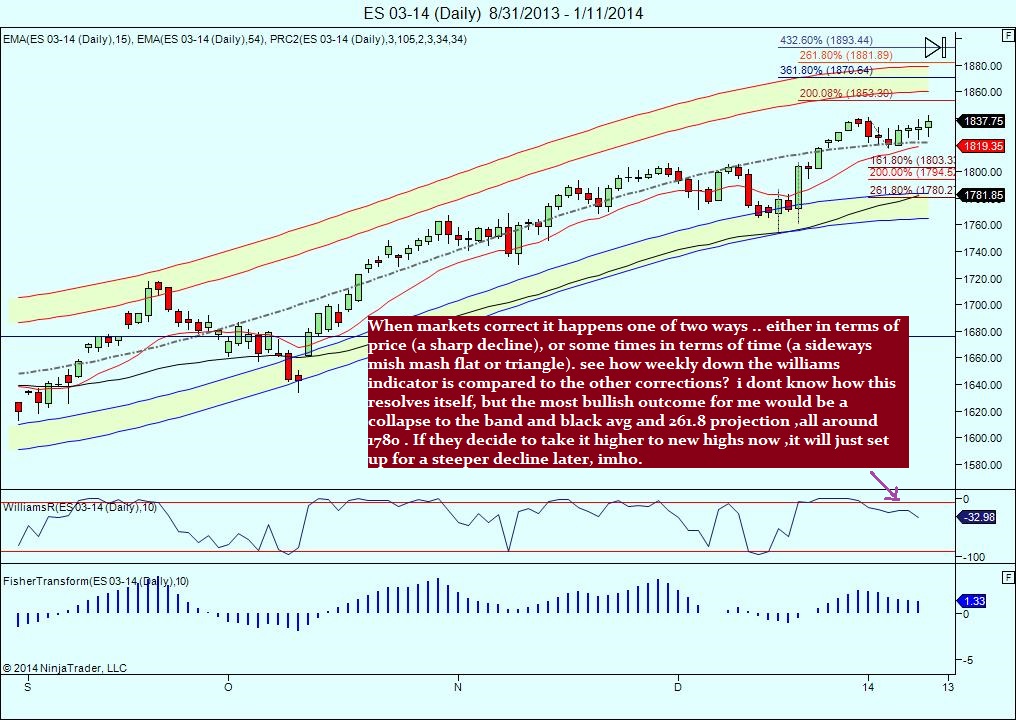
I had the 9th as a low and at least so far that was spot on .. but if we turn down now it may give a good low coming in about two weeks ... Seasonals are now up ,but weakly. .The bands are flat and ready to bend either way now. This week should resolve a lot of questions!
For my profile trading friends, courtesy Kathy Garber:
Click image for original size
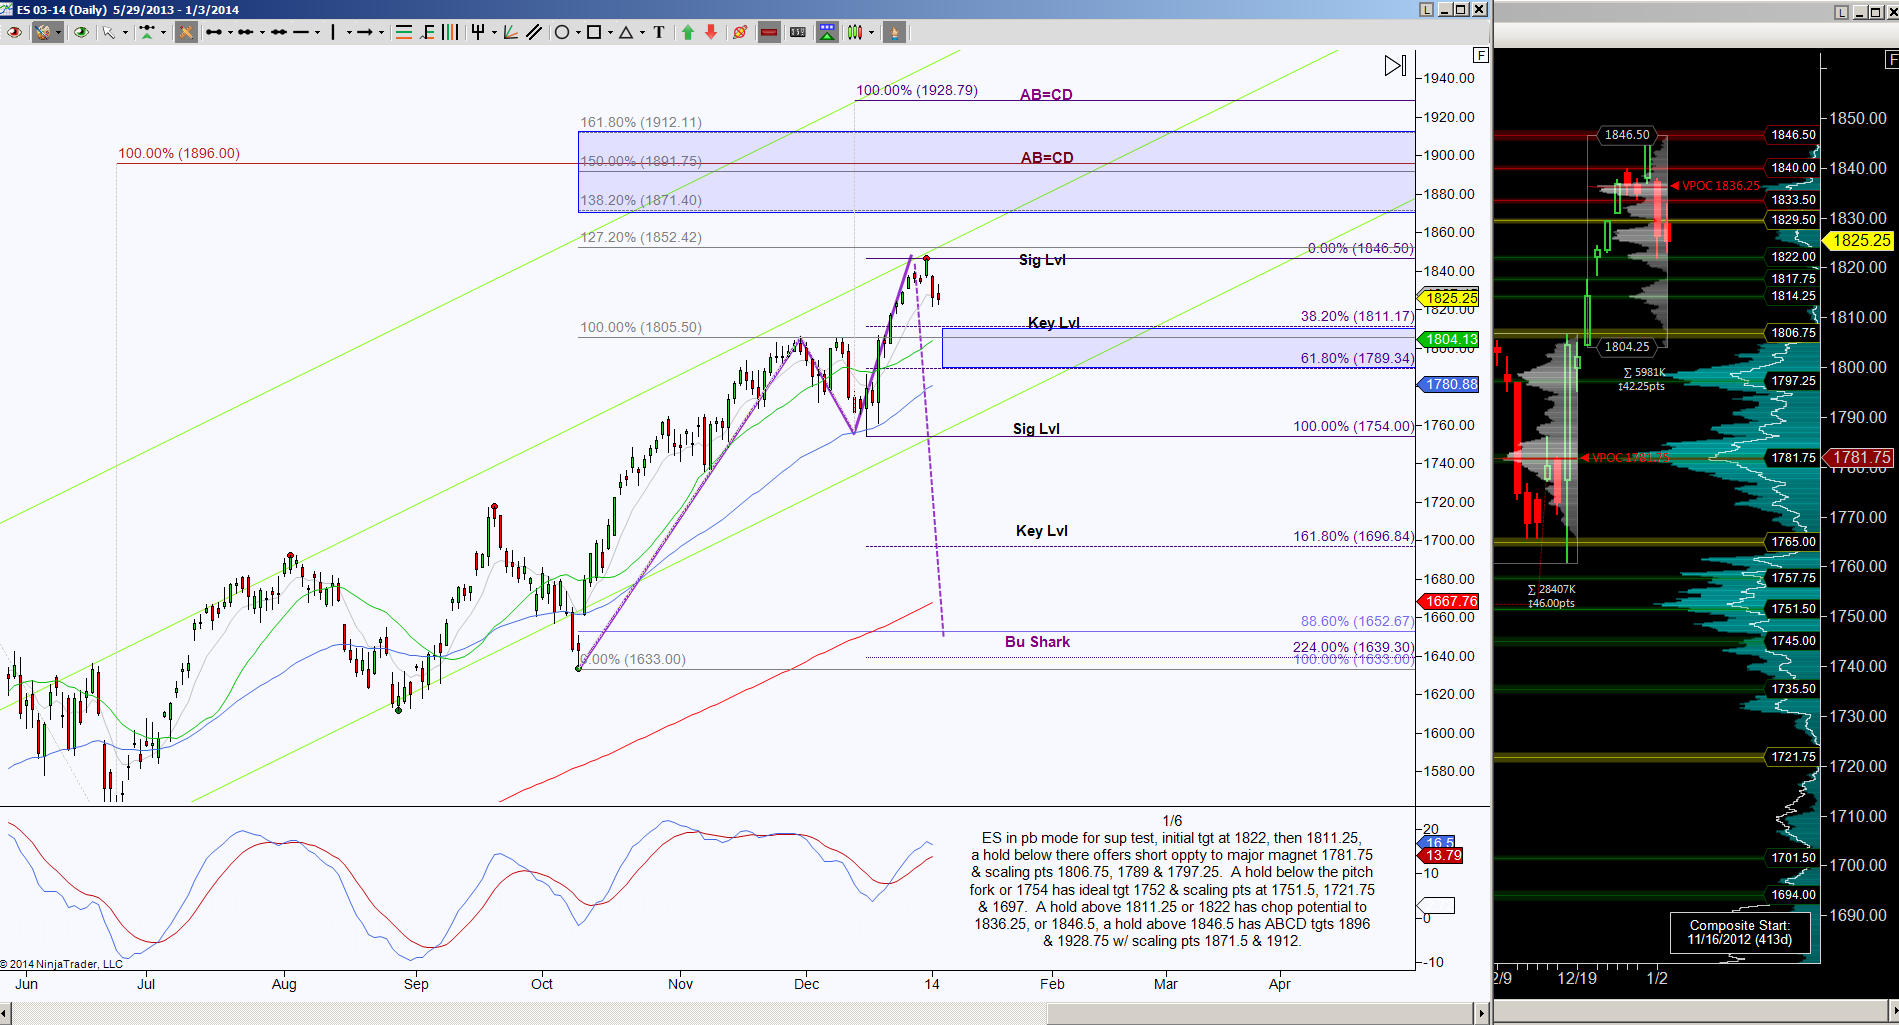
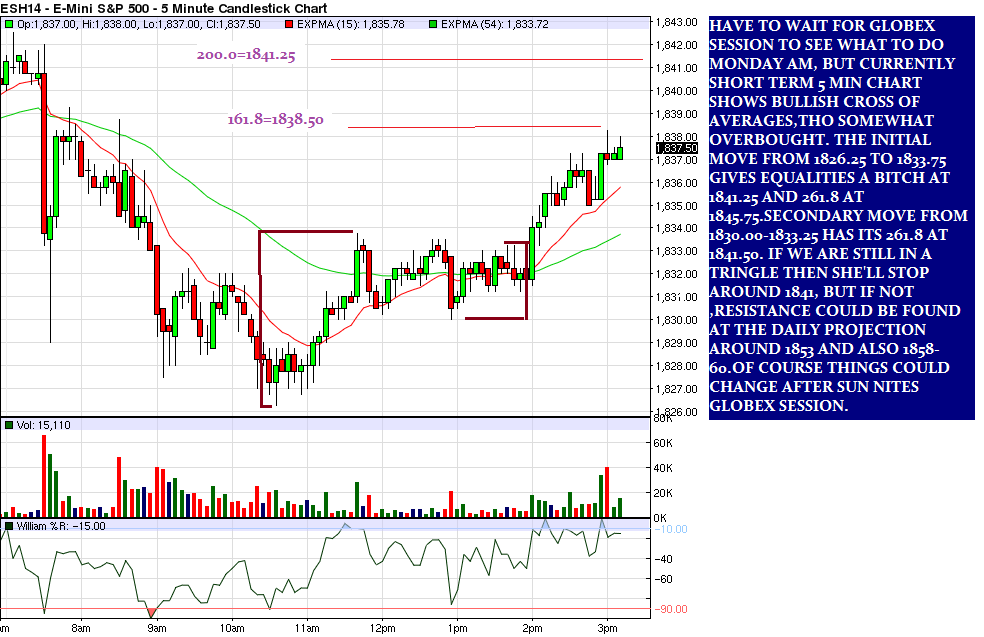
Hope you rode that triangle hit at 1826.25 up to the end of the day, but i would start being careful up here. Heres a very short term 5 min look:Click image for original size
double click the charts slowly to expand for more detail.... Good luck all!
downside numbers later, if necessary...
Click image for original size
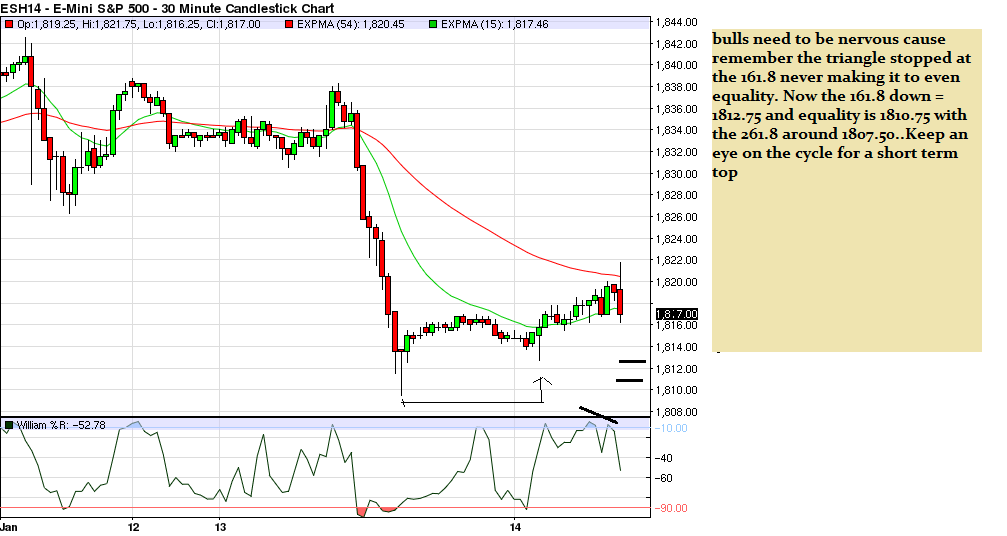
Well,i tried to show u the triangle which has of course broken to the downside,,,support is at 1810, and 1806.50 but better support would be around 1797 and of course 1780...
Click image for original size
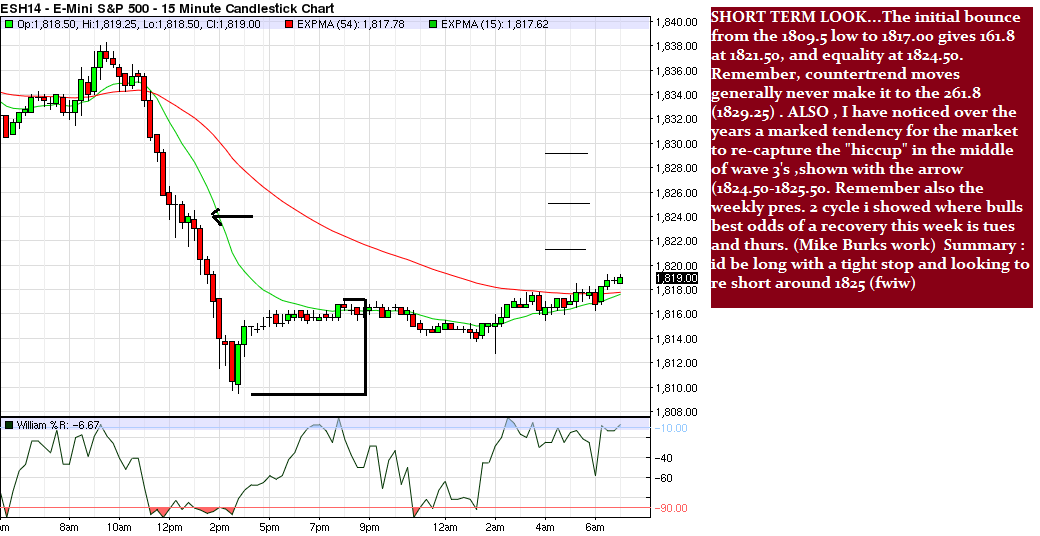
nice retraction (as expected off of the 161.8 =1821.50) . bulls better hope it stops around here ,if they want the 1825 area
Click image for original size
...
Well, i give myself just a "c" for todays analysis. the rebound today, was a hit, and the 1821.50 had the usual 2 handle pullback from 1821.75,but the 24.50-25.50 was a complete miss. the 1829.25 was slightly exceeded also. So the analysis was good but the numbers sucked . However, i do NOT believe the correction is over and the daily chart shows this cycle wont end till next week.Im still not trading ,but if i was id be selling anywhere up here going into another weak seasonal day tomorrow, fwiw
Click image for original size
Click image for original size
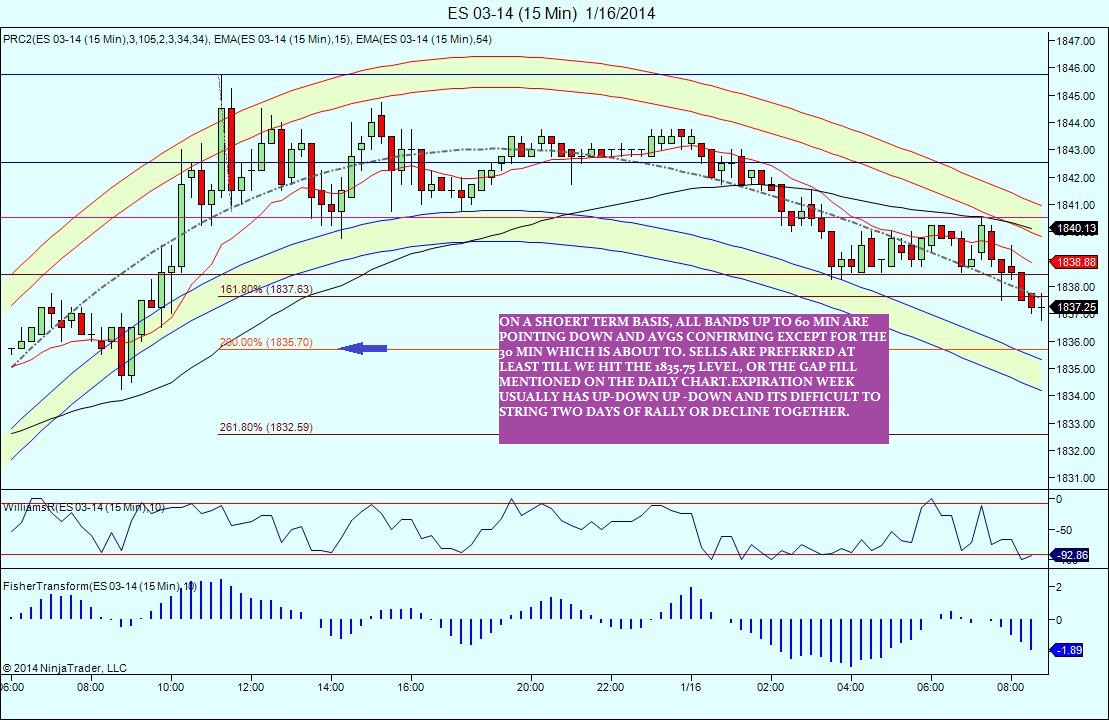
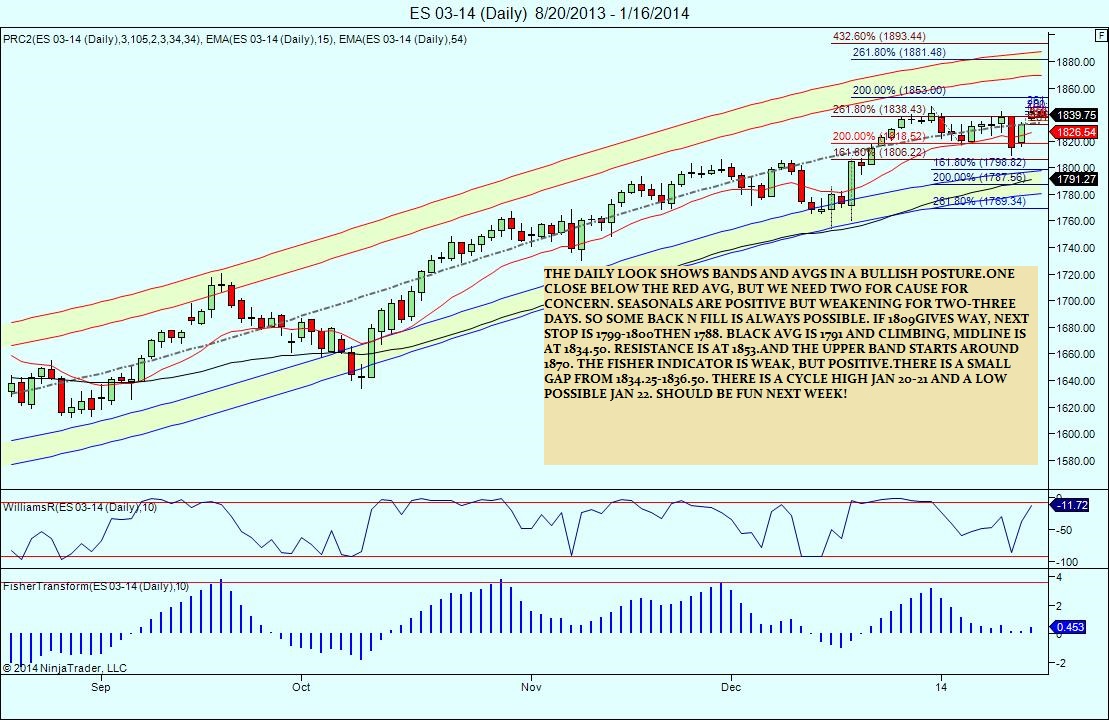
...Note : the 15 min chart is the initial move projections . You can do the math to get the full initial move projections from 1845.75-1839.75...ie 1836.00,1830.00,
Emini Day Trading /
Daily Notes /
Forecast /
Economic Events /
Search /
Terms and Conditions /
Disclaimer /
Books /
Online Books /
Site Map /
Contact /
Privacy Policy /
Links /
About /
Day Trading Forum /
Investment Calculators /
Pivot Point Calculator /
Market Profile Generator /
Fibonacci Calculator /
Mailing List /
Advertise Here /
Articles /
Financial Terms /
Brokers /
Software /
Holidays /
Stock Split Calendar /
Mortgage Calculator /
Donate
Copyright © 2004-2023, MyPivots. All rights reserved.
Copyright © 2004-2023, MyPivots. All rights reserved.