MA
MarcinO
Rep: 67
Posts: 5,506
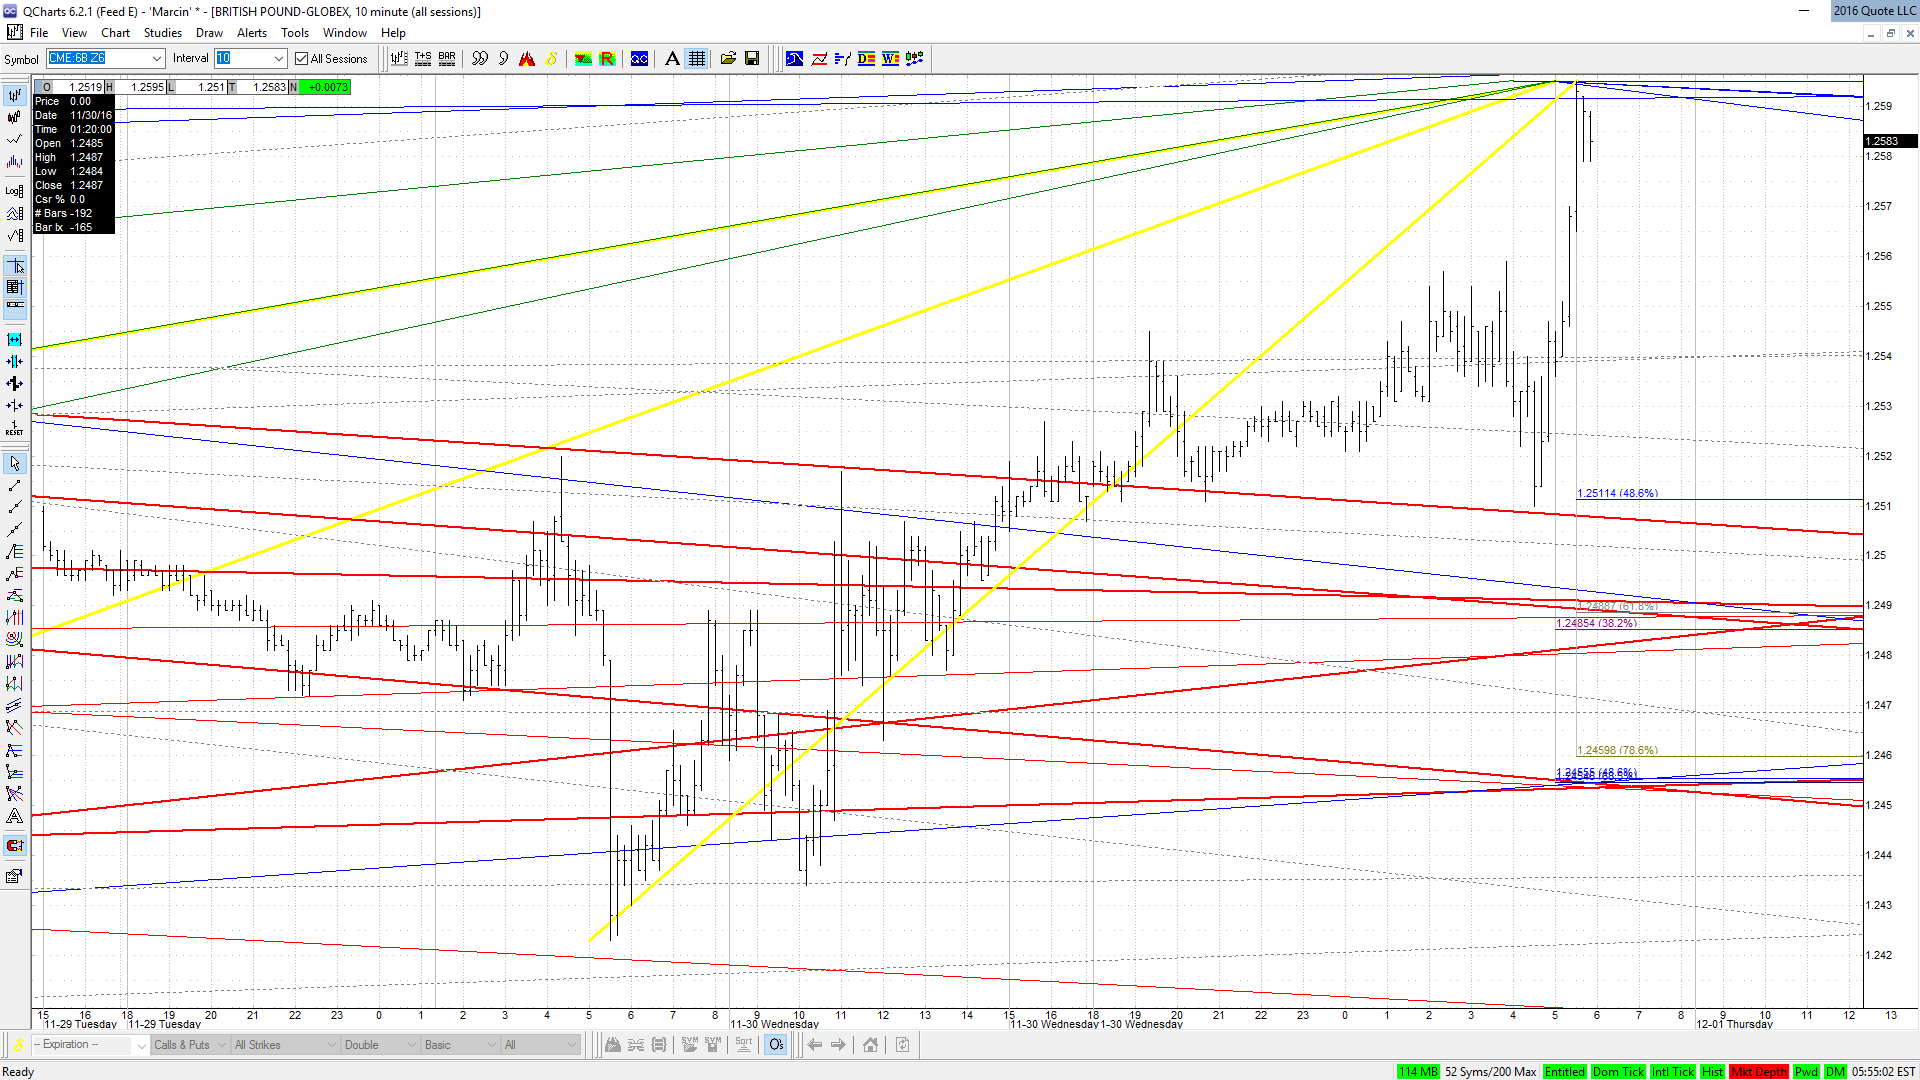
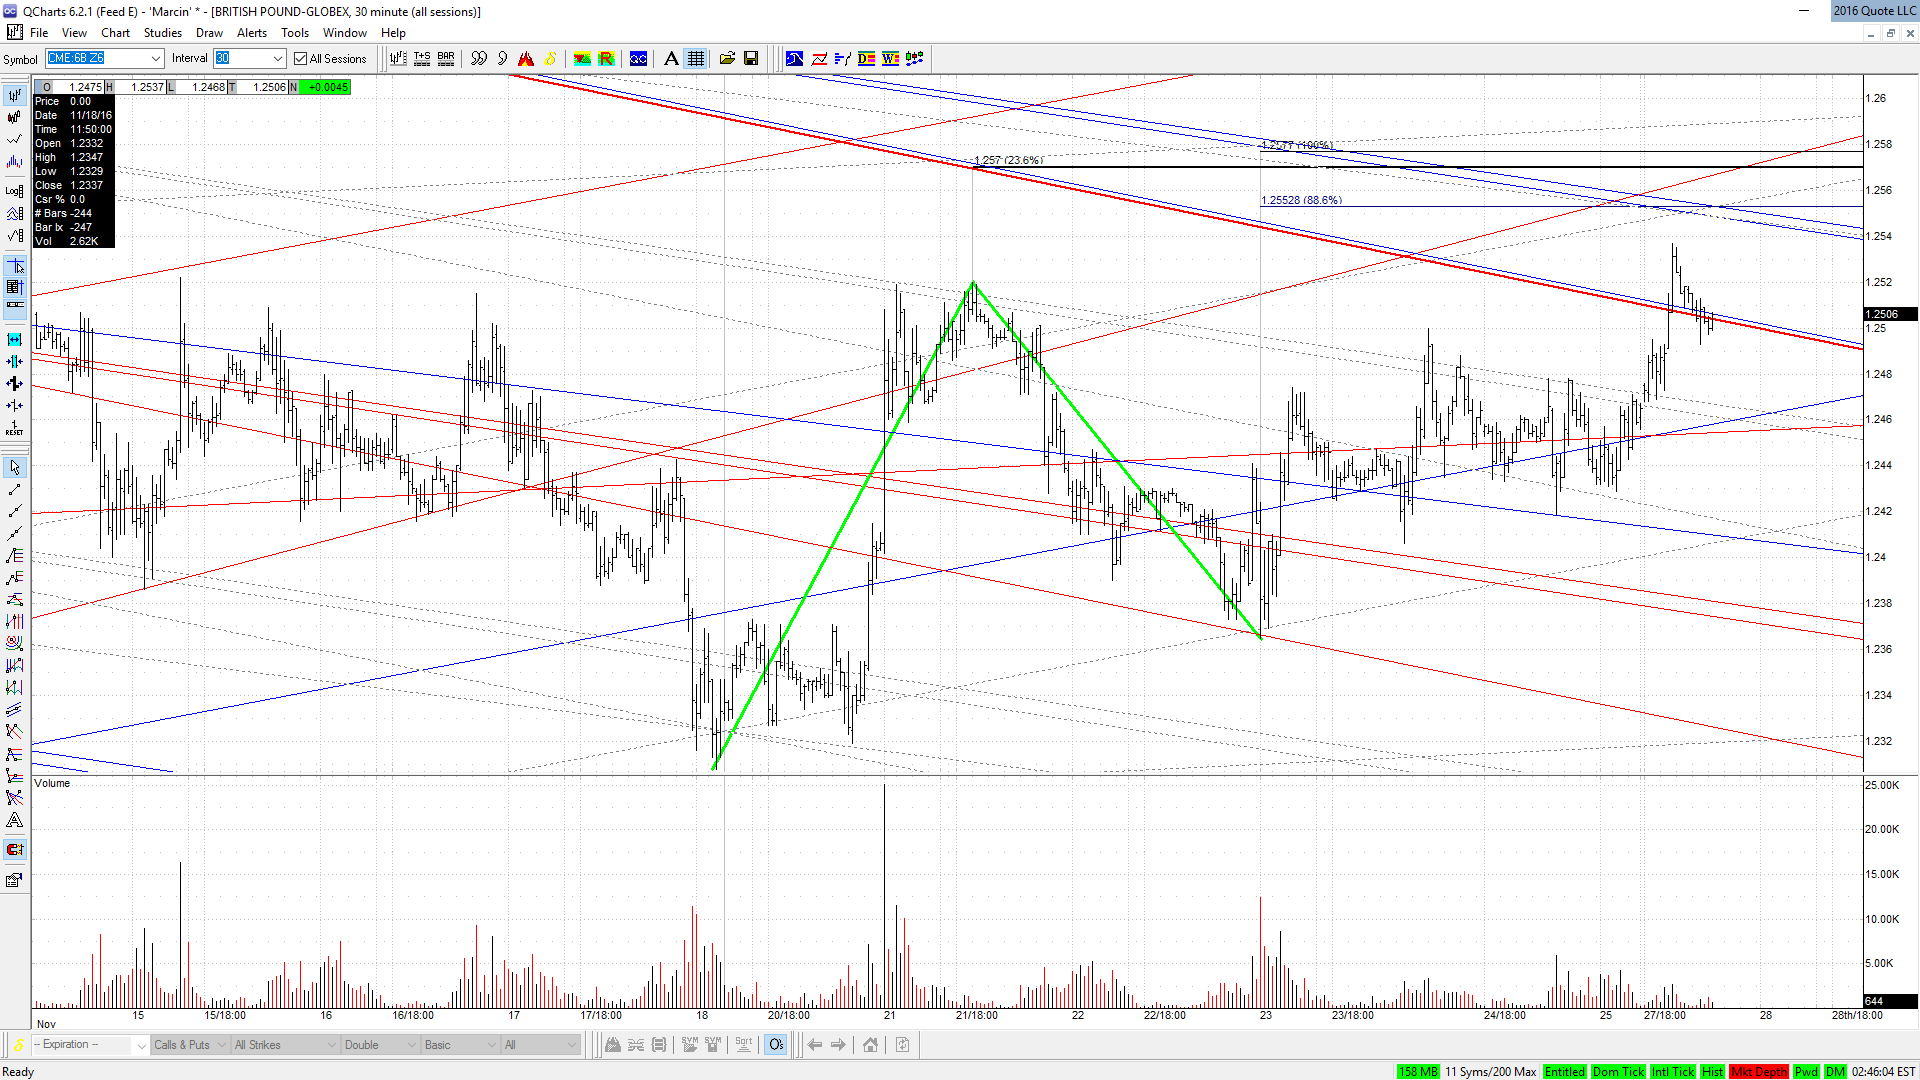
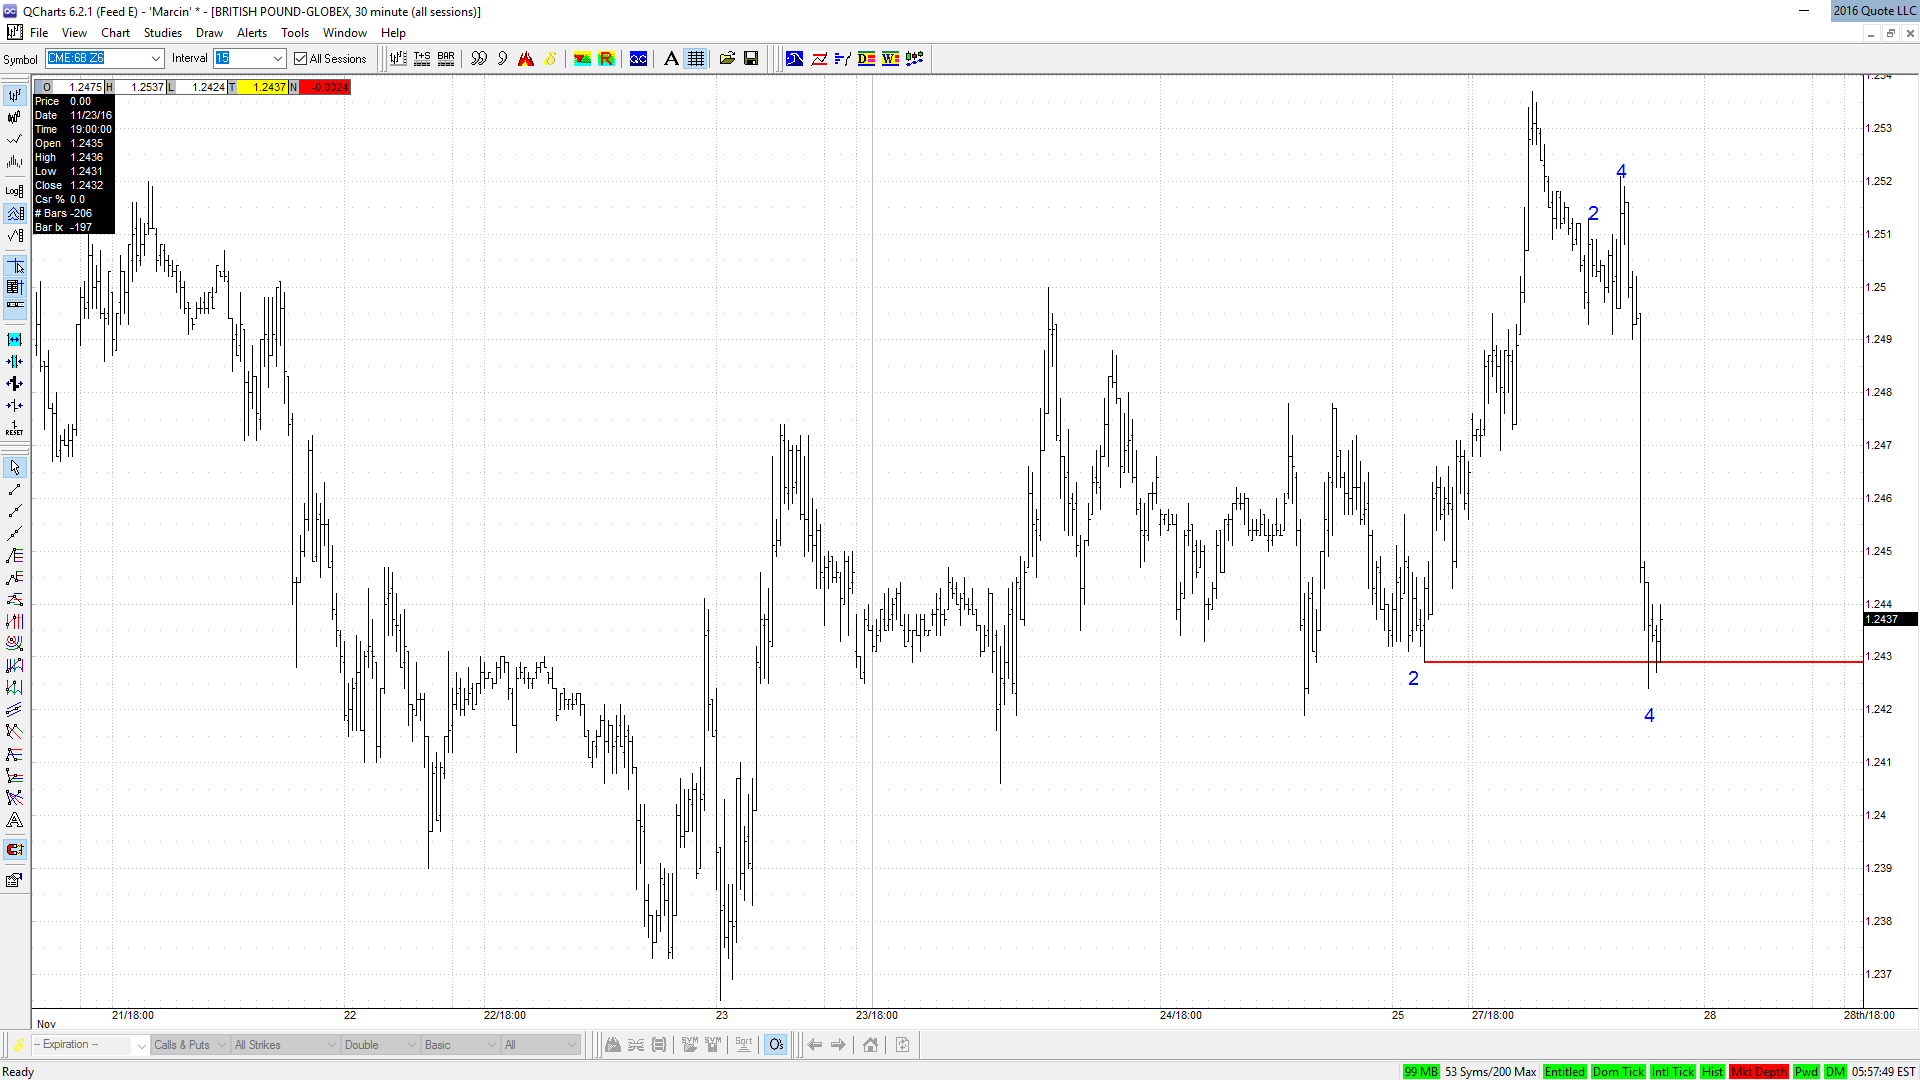
It seems that they are still playing their 'W2 fakeout' game. If so, it's time to go long.
Click image for original size
AL
albert
Rep: 99
Posts: 3,094
Found SUM in StochChart Daily Predefined Scan, BULLISH 50/200-DAY MA CROSSOVERS. Weekly view shows 1.128*AB=CD and price levelling out at about 1.272 fibo, basis Points A and D.
Daily charts show 50 sma crossing over 200 sma, and 0.886 fibo at top right os chart,
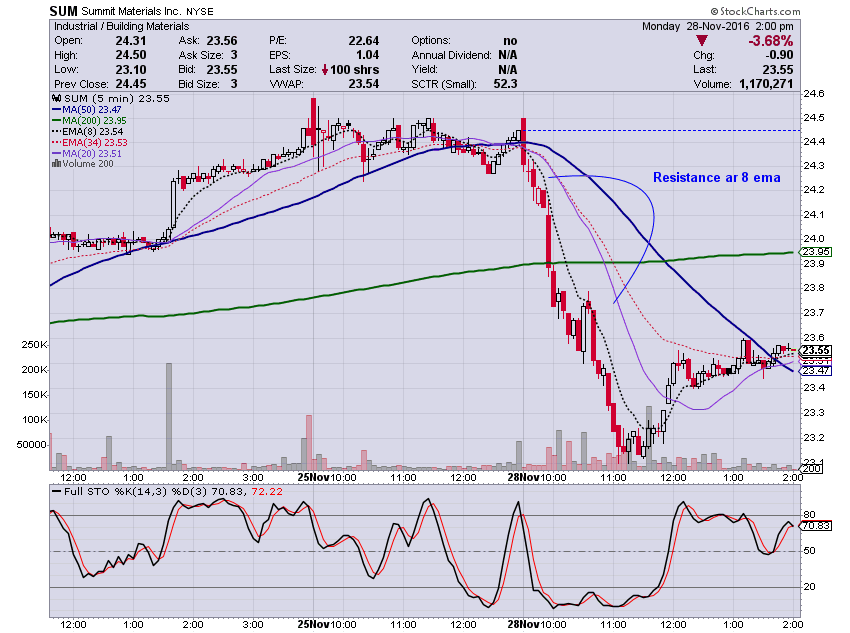
5 M\minute TF shows downward price motion, with resistance at 8ema.
Al
Click image for original size
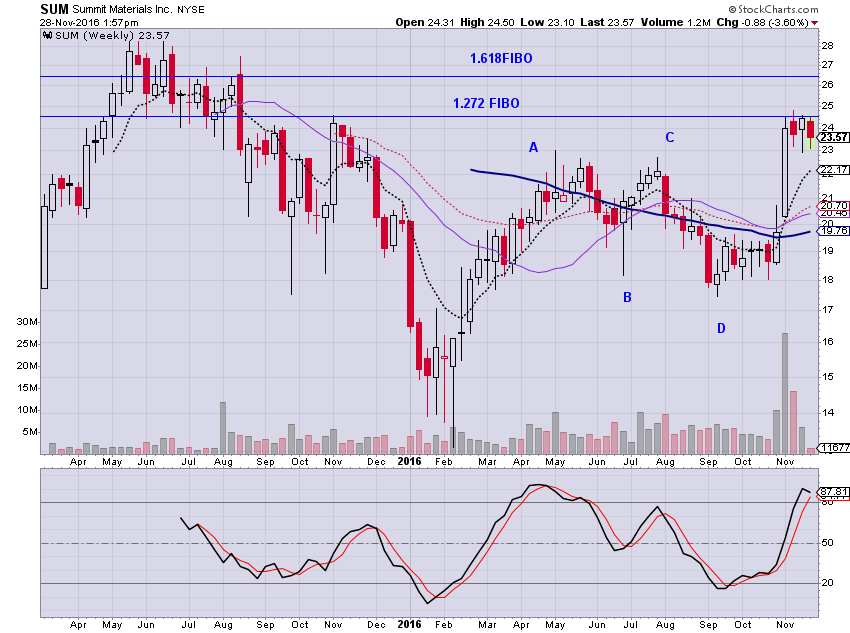
Daily charts show 50 sma crossing over 200 sma, and 0.886 fibo at top right os chart,
Click image for original size
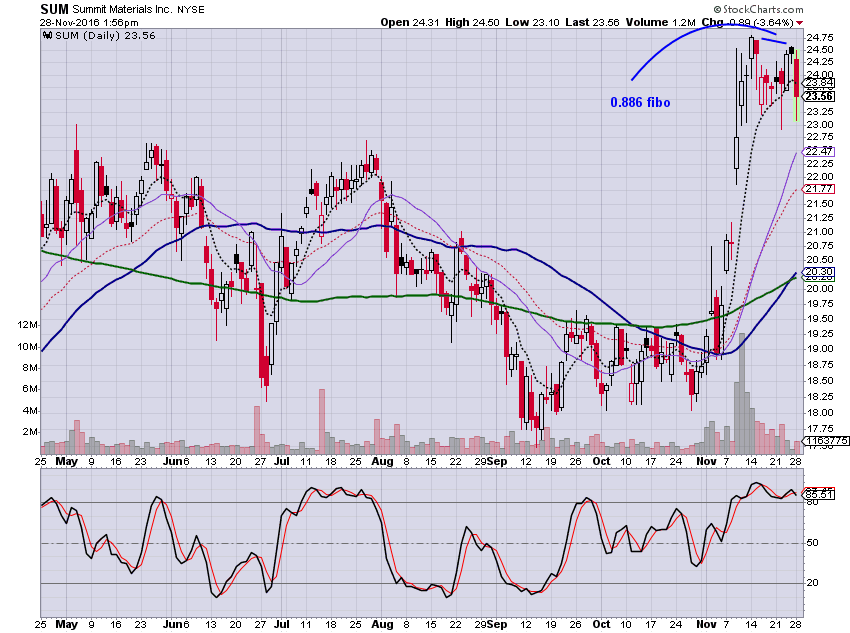
5 M\minute TF shows downward price motion, with resistance at 8ema.
Click image for original size
Al