ES K.I.S.S 5-14-18
prices I'm using today based on last weeks posts
2641 - 2642 ****
2635.75
2632.50
2629.75 ***** key zone area
2626.25******key zone area
2623.50 - this is more complex to label but you can get it...I have faith
2620.50
kinda tight today...wish targets had more spread between them...I will edit this post later...newbies or those who are following this method should see if they can come up with the labels before I post them later.......this is the same test I'm giving to my "trainee" friend.....
I usually look for at least two of our key ideas to trade out in early trade ( I am not saying I always can hold for these ideas but I try). Today we saw the R1 level and the overnight high....we also saw twice the OR work out and we only entered on one side today....the long side......very different then friday...damn....I'm giving away some of the answers to the "test".
I'll get to marking the levels later. Hope all did well today.
I'll get to marking the levels later. Hope all did well today.
one other thing.....95 % of the time we will print a weekly number so those are way up at 2760 or down near 2703....u can use the first 90 minutes of trade and or the first 1/2 of a trading day to buy or sell options in order to try and target those..........my plan is to buy the 271.50 put options on new lows of the day....just pointing this out
lets continue with this.....we hit Fridays highs and Fridays close.....now those two key zones are in play and if buyers are going to step back in today then I would expect it to happen from the 26.75 - 29.75........but I'd like to see any buyers fail and have us drop down to the weekly pivot number....may not happen today but that would be the plan for our put options
Bruce, for weekly numbers, do you look at RTH or ETH? The RTH weekly numbers I have are 2757.25 (R1) and 2704.75 (PP); so I am assuming your numbers are ETH. Thanks in advance.
Originally posted by BruceM
one other thing.....95 % of the time we will print a weekly number so those are way up at 2760 or down near 2703....u can use the first 90 minutes of trade and or the first 1/2 of a trading day to buy or sell options in order to try and target those..........my plan is to buy the 271.50 put options on new lows of the day....just pointing this out
yours are correct.....I was just eyeballing them and should have written " up around 2760 " and "down around 2703"........but I'm glad you are doing your own work and brought that to the attention of the forum.....there is usually a bit more wiggle room on weekly numbers and for me if my option trade goes well I will be out of the market in front of them and would not be waiting for an exact hit like I would on a daily number while day trading.....so using the RTH is the way to go......thanks for putting that out there.....and I hope you have been well
Originally posted by stocksster
Bruce, for weekly numbers, do you look at RTH or ETH? The RTH weekly numbers I have are 2757.25 (R1) and 2704.75 (PP); so I am assuming your numbers are ETH. Thanks in advance.
Originally posted by BruceM
one other thing.....95 % of the time we will print a weekly number so those are way up at 2760 or down near 2703....u can use the first 90 minutes of trade and or the first 1/2 of a trading day to buy or sell options in order to try and target those..........my plan is to buy the 271.50 put options on new lows of the day....just pointing this out
the plan for me is to cover the puts if we can trade to 2713 on the ES sometime before fridays expiry....the sooner the better...so that is almost 10 points in front of the weekly pivot.....these weeklies erode fast and while they are up $32 per contract that can be snuffed out quickly by no movement and the time decay
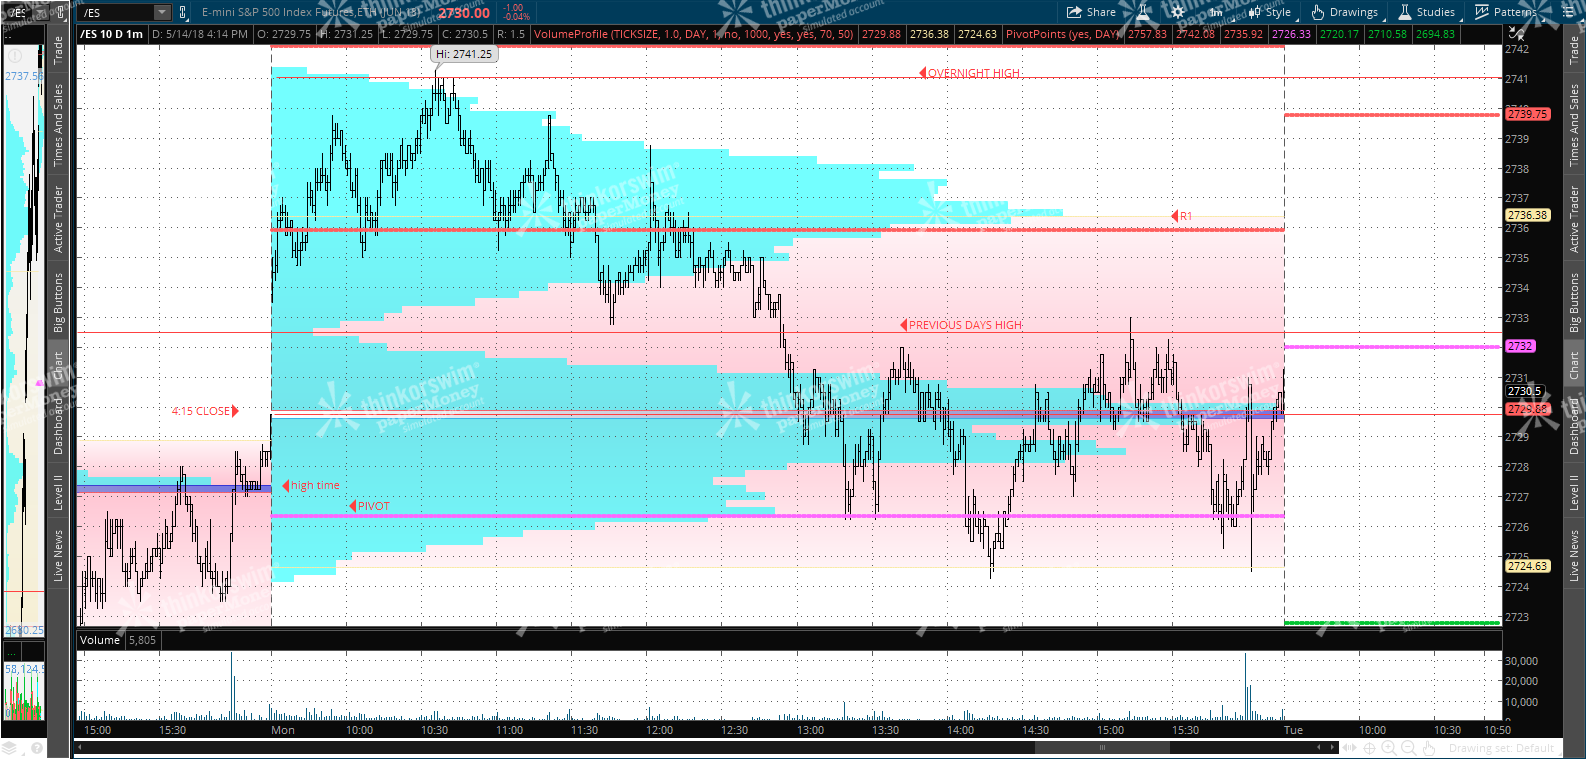
A few things not marked on this chart
1) The 4 pm close of Friday - that was right near the Pivot and High Time from Friday . Price at 4pm was also 2727.25
2) The Sunday night open price of 2727.25 which was also the overnight low
3) I'm sure there are others
I hope most passed the test....
1) The 4 pm close of Friday - that was right near the Pivot and High Time from Friday . Price at 4pm was also 2727.25
2) The Sunday night open price of 2727.25 which was also the overnight low
3) I'm sure there are others
I hope most passed the test....
Click image for original size
Emini Day Trading /
Daily Notes /
Forecast /
Economic Events /
Search /
Terms and Conditions /
Disclaimer /
Books /
Online Books /
Site Map /
Contact /
Privacy Policy /
Links /
About /
Day Trading Forum /
Investment Calculators /
Pivot Point Calculator /
Market Profile Generator /
Fibonacci Calculator /
Mailing List /
Advertise Here /
Articles /
Financial Terms /
Brokers /
Software /
Holidays /
Stock Split Calendar /
Mortgage Calculator /
Donate
Copyright © 2004-2023, MyPivots. All rights reserved.
Copyright © 2004-2023, MyPivots. All rights reserved.