Starting it off.
Al
RA
rat89
Rep: 0
Posts: 7,015
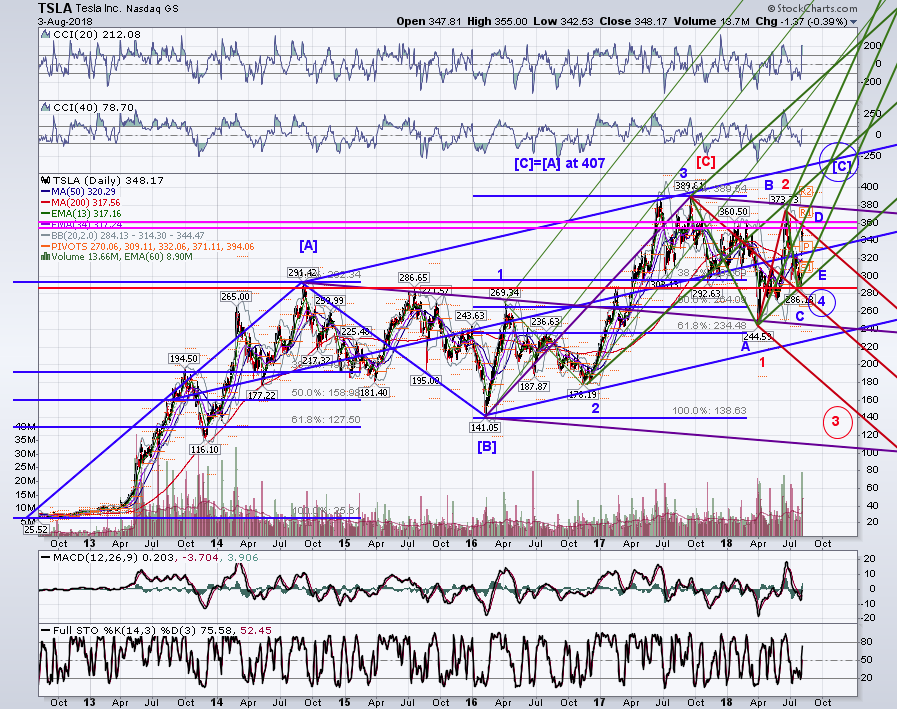
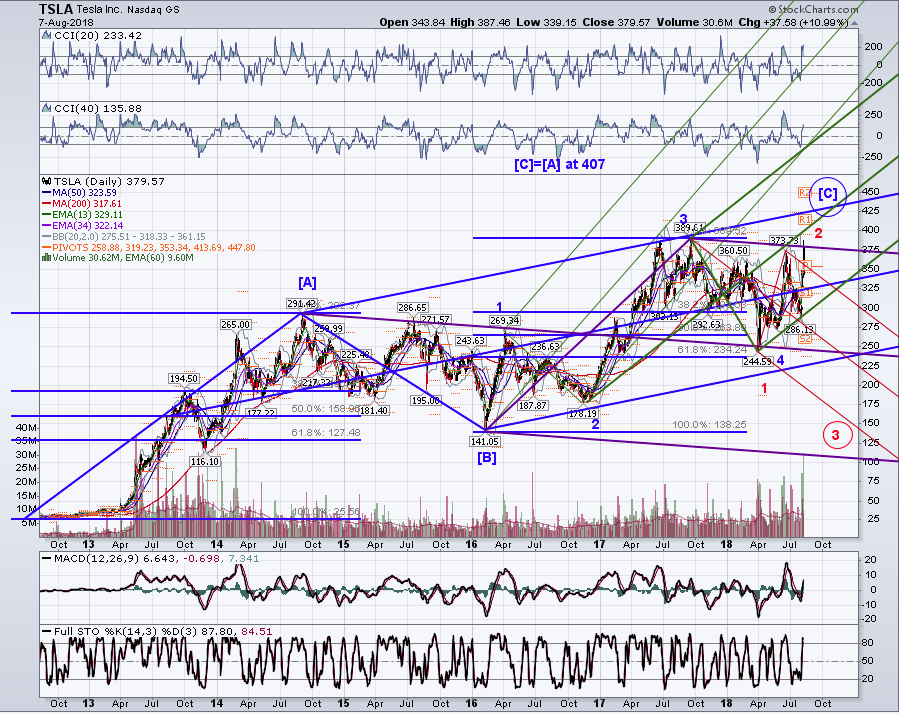
tsla daily - there are two variants of the count - the blue count says the hight is not in, and targets the 407 area....it has wave 3 completing at 389, and is currently tracing out a wave 4 triangle, with ABCD in place, and D at 355. E must complete above 286, and then wave 5 up to 407. the reason I look for a wave 4 triangle is that the low of 244 violates the wave 1 high at 269.
The red count says that the bull move completed at 389, and that wave 1 ended at 244, wave 2 ended at 373, and that within wave 3, (1) completed at 286, (2) likely completed at 355 Friday at a retrace of .786 of wave (1), and that wave (3) should now be an impulsive move down. Target areas for wave (3) are 209, 184, and 144.
A break above 374 confirms the blue count. A break below 286 confirms the red count.
Click image for original size
AL
albert
Rep: 99
Posts: 3,094
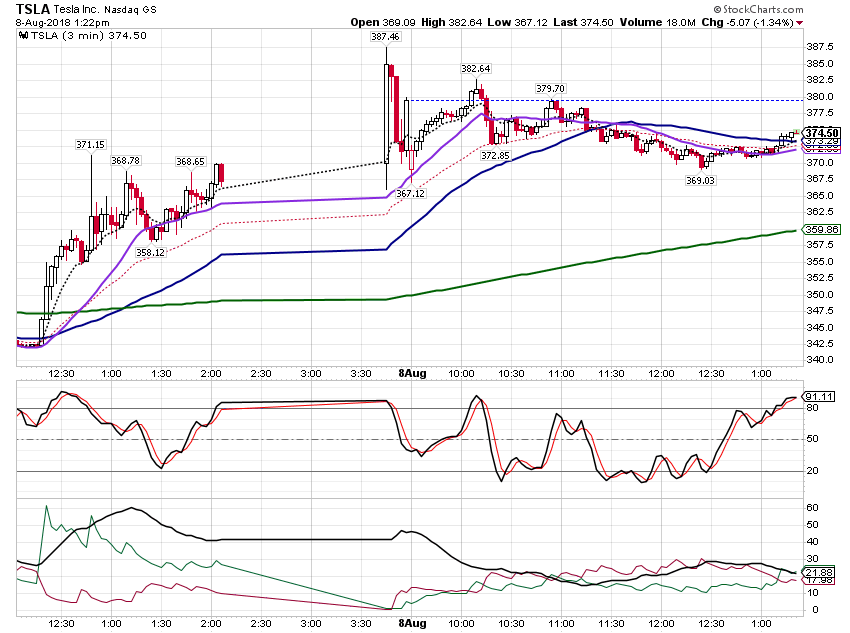
Paper trading TSLA. Ouch. I was in a bearish trade on TSLA going into earnings, and was short a call. TESLA trading was halted yesterday for a while. I took a loss and am seriously questioning my practice of not using a stop loss on options trades.
Al
Click image for original size
Al