ES 8-22-22
Click image for original size
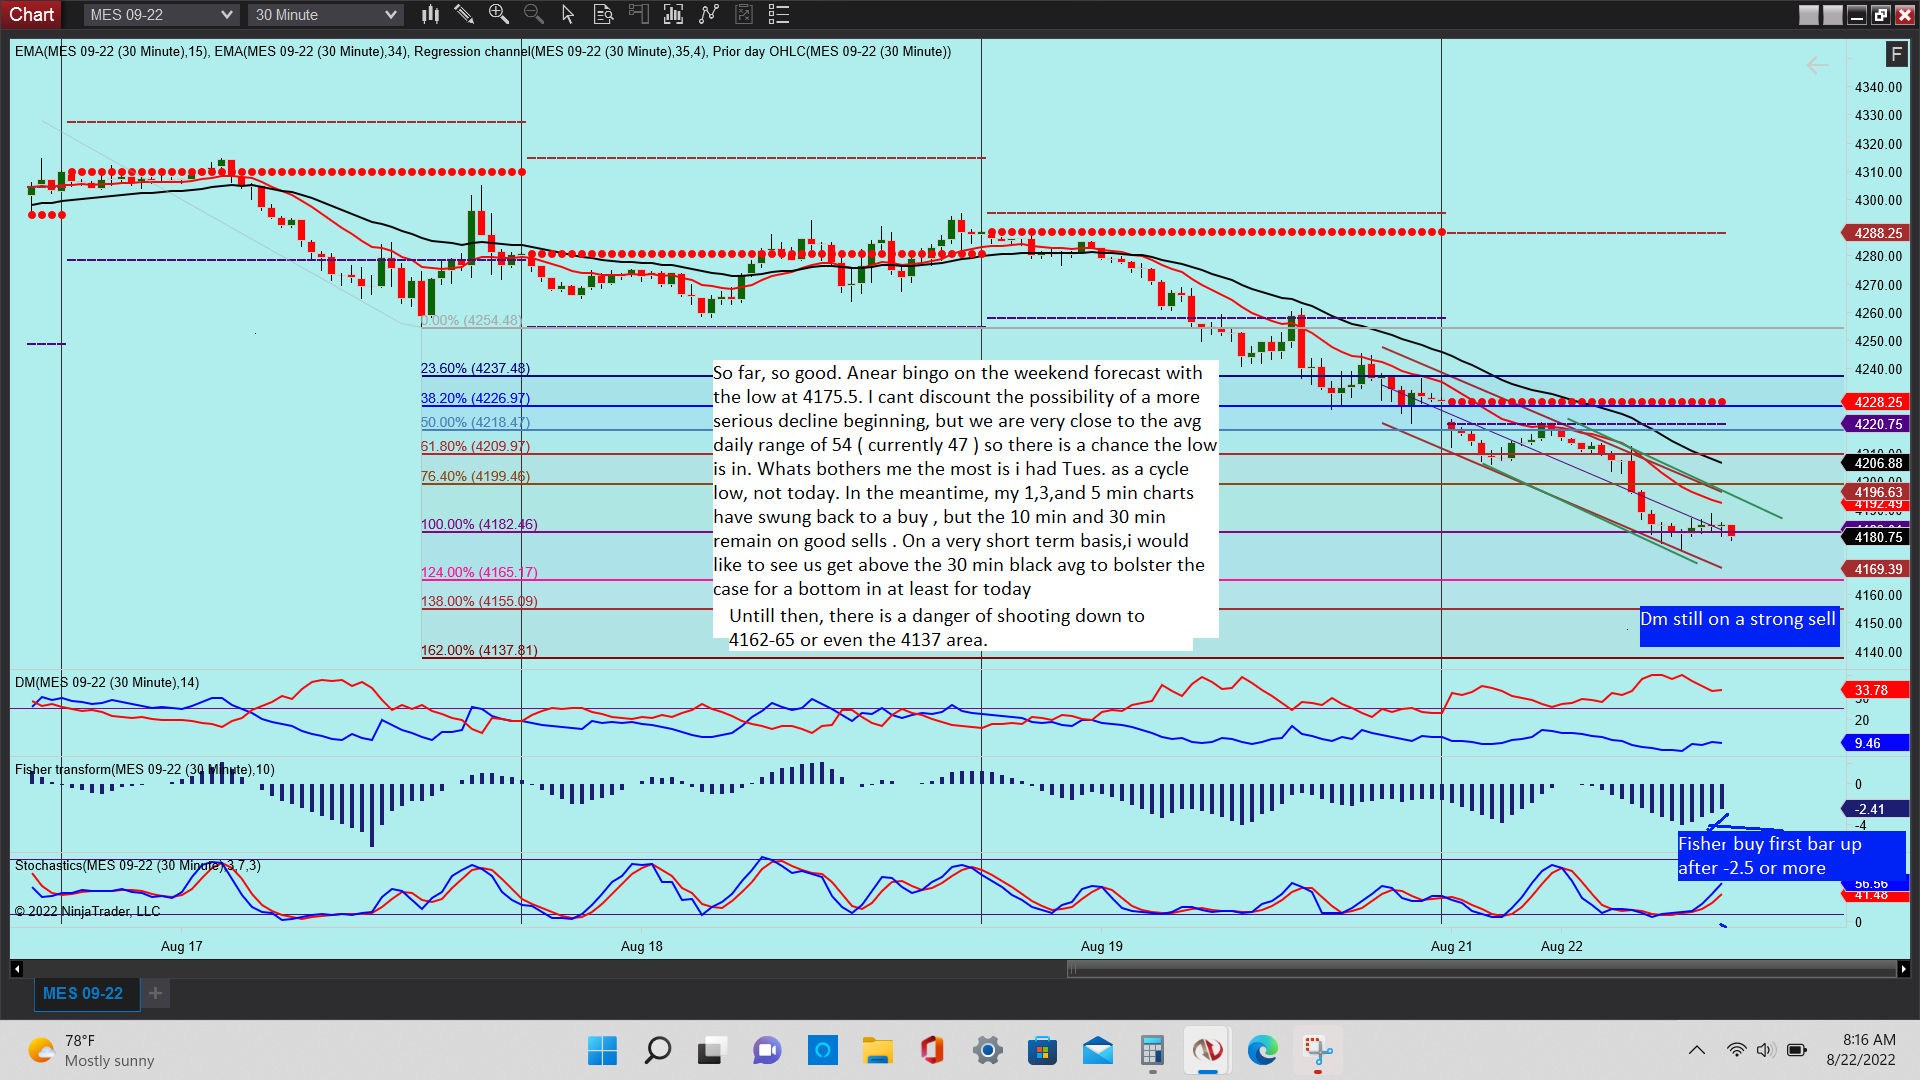
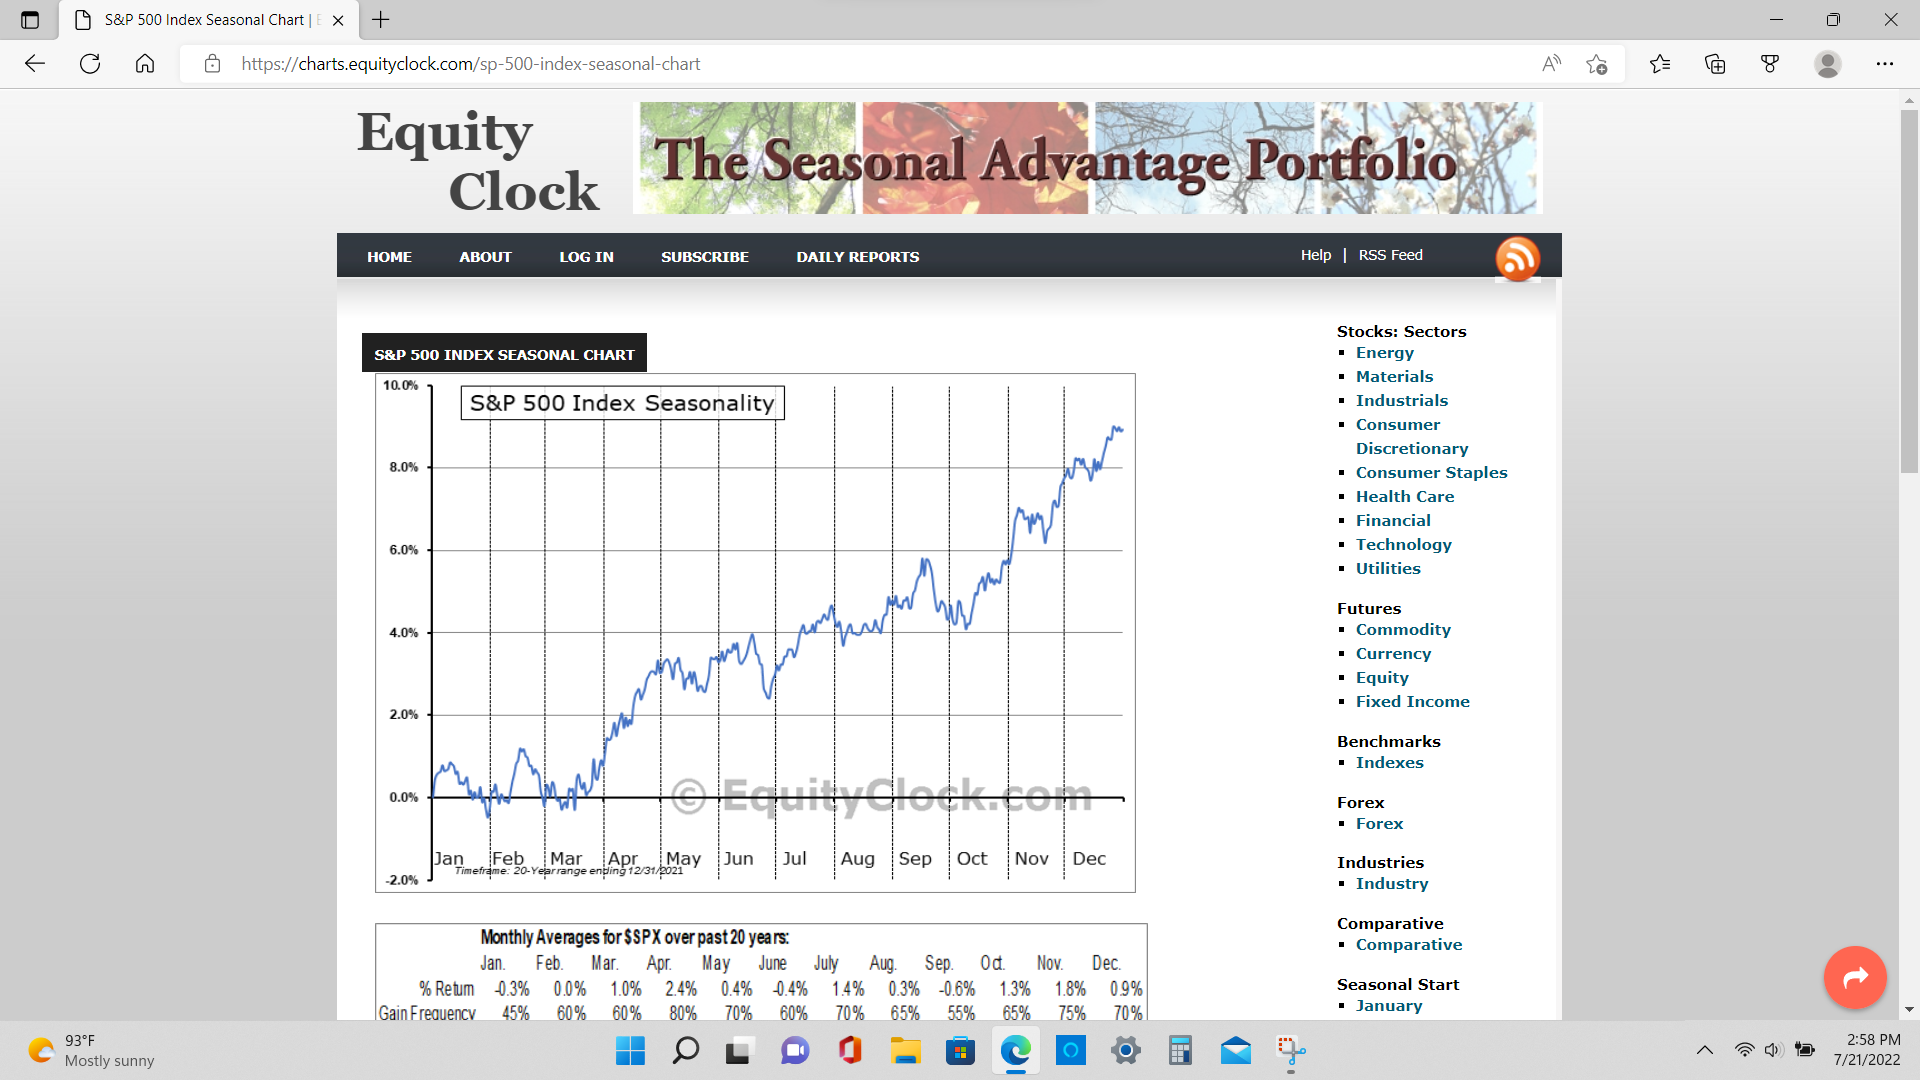
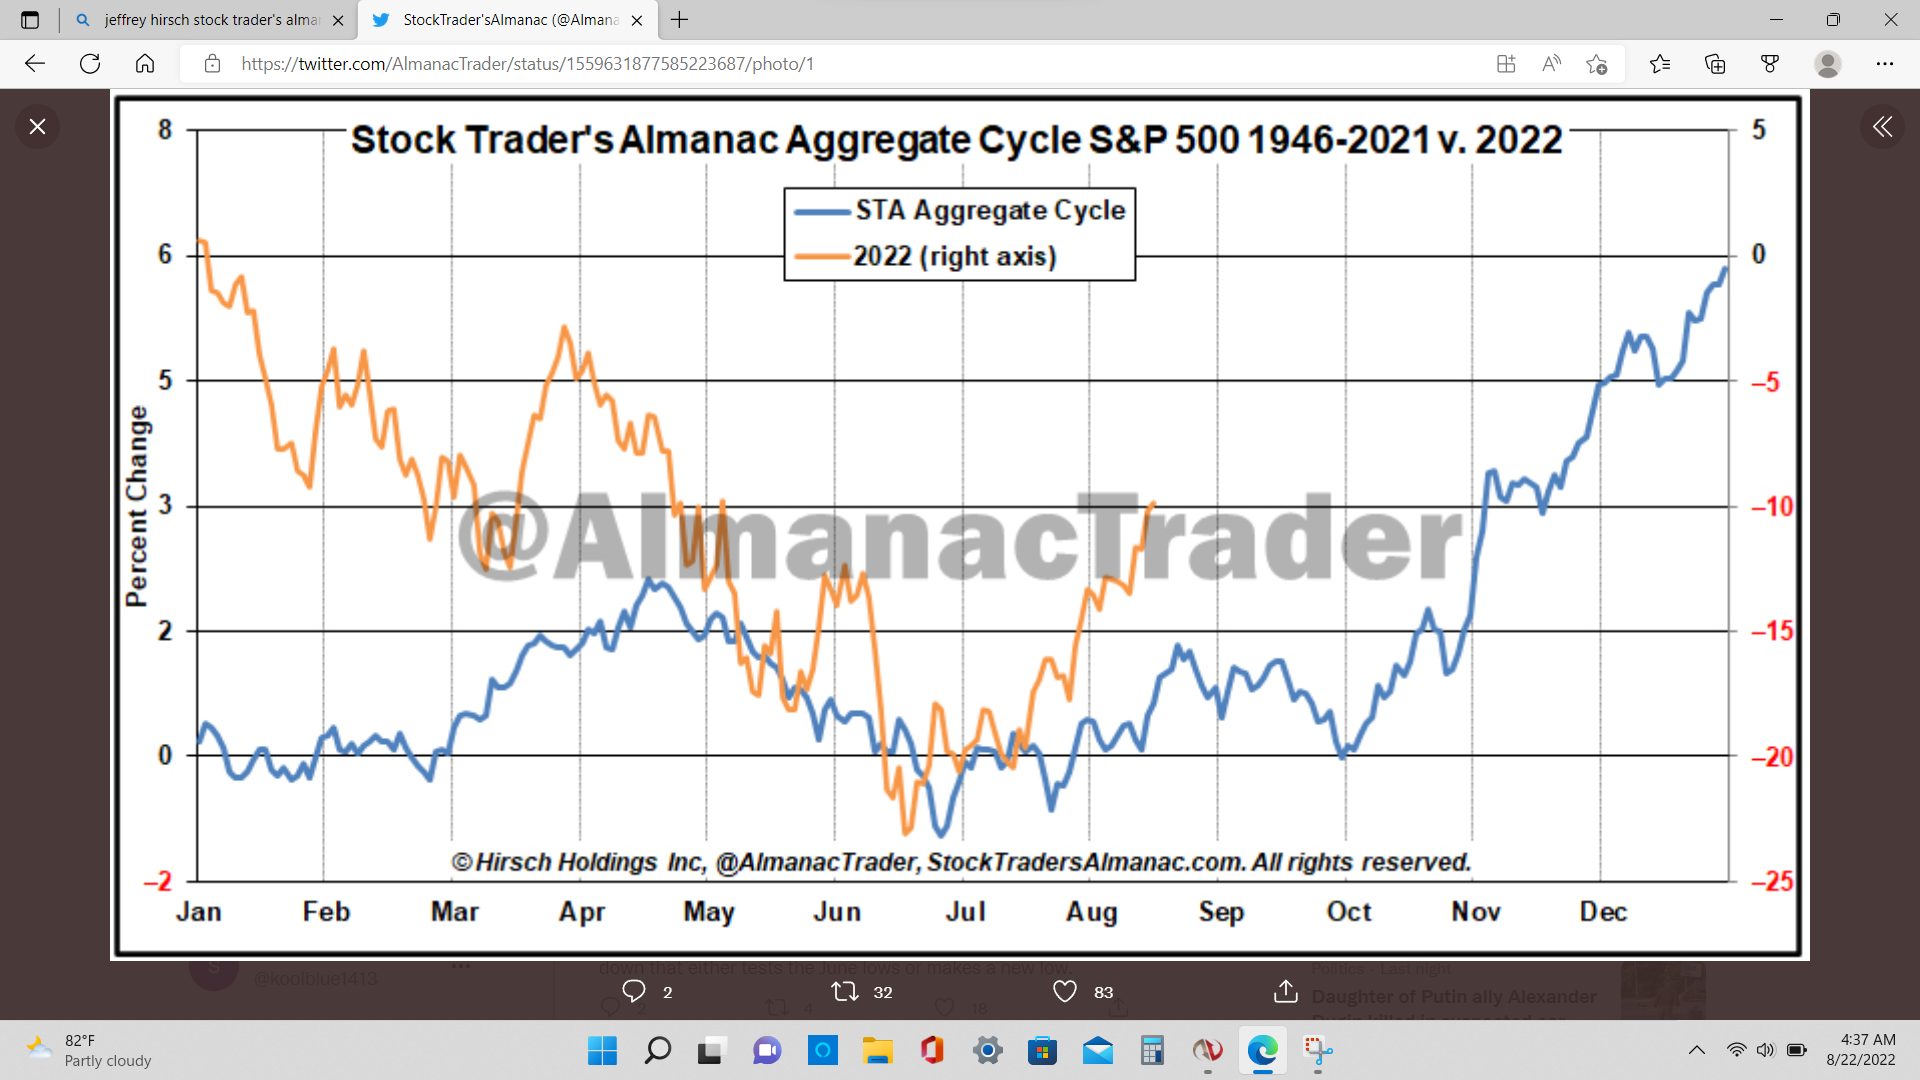
You have probably seen the seasonality charts i have posted in the past, but i forgot this isnt a avg year.... its an election year! mid terms. The sesonality does slightly change , so here is the chart which incorprates the mid term year, 4-year Presidential cycle, and the first term Presidential cycle. the blue is the sesonality and the orange is the current market. The takeaway for me is : we are at or very close to a top of some sort here, but look at that period from mid September to early October! Thats gonna crush a lot of people ,this is the regular seasonal chart,
Click image for original size
And here is the midterm one:Click image for original size
Emini Day Trading /
Daily Notes /
Forecast /
Economic Events /
Search /
Terms and Conditions /
Disclaimer /
Books /
Online Books /
Site Map /
Contact /
Privacy Policy /
Links /
About /
Day Trading Forum /
Investment Calculators /
Pivot Point Calculator /
Market Profile Generator /
Fibonacci Calculator /
Mailing List /
Advertise Here /
Articles /
Financial Terms /
Brokers /
Software /
Holidays /
Stock Split Calendar /
Mortgage Calculator /
Donate
Copyright © 2004-2023, MyPivots. All rights reserved.
Copyright © 2004-2023, MyPivots. All rights reserved.