ES 8-30-22
Click image for original size
" On Aug. 25, the VIX confirmed it was trading in a new uptrend by forming a higher low above the $19.50 area. On Friday, the VIX reacted to the trend by surging higher and on Monday printed a higher high within the pattern.
Friday’s surge caused the VIX to reclaim the 200-day simple moving average (SMA) as support, which is a positive sign for bearish stock traders. It may make bearish traders concerned, however, that on Aug. 24, the 50-day SMA crossed below the 200-day, which caused a death cross to print. If the VIX is able to remain above the 200-day SMA for a period of time, the 50-day SMA will cross back above the 200-day, which will cause a golden cross to form. The long upper wick the VIX was working to print on Monday suggests lower prices may come on Tuesday, which indicates the stock market could trade higher. If the VIX falls lower, traders will want to watch to see if the VIX prints a bullish candlestick, such as a doji or hammer candlestick, to indicate the next higher low has printed, and the uptrend will continue. Bullish stock market traders want to see the VIX drop back down below the 200-day SMA over the next few days to keep the death cross intact. It should be noted that the 50-day SMA on the VIX hasn’t trended below the 200-day since Dec. 2, 2021. The VIX has resistance above at $27.75 and $29.82 and support below at $25.66 and $23.15." The way i use the vix is as follows: vix under 20 (on a closing basis ) is where interim tops are made (like the recent 4327 one, vix was at 19.50 or so for 3 days) vix 20-25 is bullish . vix above 25 is bearish (like now) interim bottoms =above 35-40 and major bottoms are formed at 45 or higher.Major bottoms come below16.
Friday’s surge caused the VIX to reclaim the 200-day simple moving average (SMA) as support, which is a positive sign for bearish stock traders. It may make bearish traders concerned, however, that on Aug. 24, the 50-day SMA crossed below the 200-day, which caused a death cross to print. If the VIX is able to remain above the 200-day SMA for a period of time, the 50-day SMA will cross back above the 200-day, which will cause a golden cross to form. The long upper wick the VIX was working to print on Monday suggests lower prices may come on Tuesday, which indicates the stock market could trade higher. If the VIX falls lower, traders will want to watch to see if the VIX prints a bullish candlestick, such as a doji or hammer candlestick, to indicate the next higher low has printed, and the uptrend will continue. Bullish stock market traders want to see the VIX drop back down below the 200-day SMA over the next few days to keep the death cross intact. It should be noted that the 50-day SMA on the VIX hasn’t trended below the 200-day since Dec. 2, 2021. The VIX has resistance above at $27.75 and $29.82 and support below at $25.66 and $23.15." The way i use the vix is as follows: vix under 20 (on a closing basis ) is where interim tops are made (like the recent 4327 one, vix was at 19.50 or so for 3 days) vix 20-25 is bullish . vix above 25 is bearish (like now) interim bottoms =above 35-40 and major bottoms are formed at 45 or higher.Major bottoms come below16.
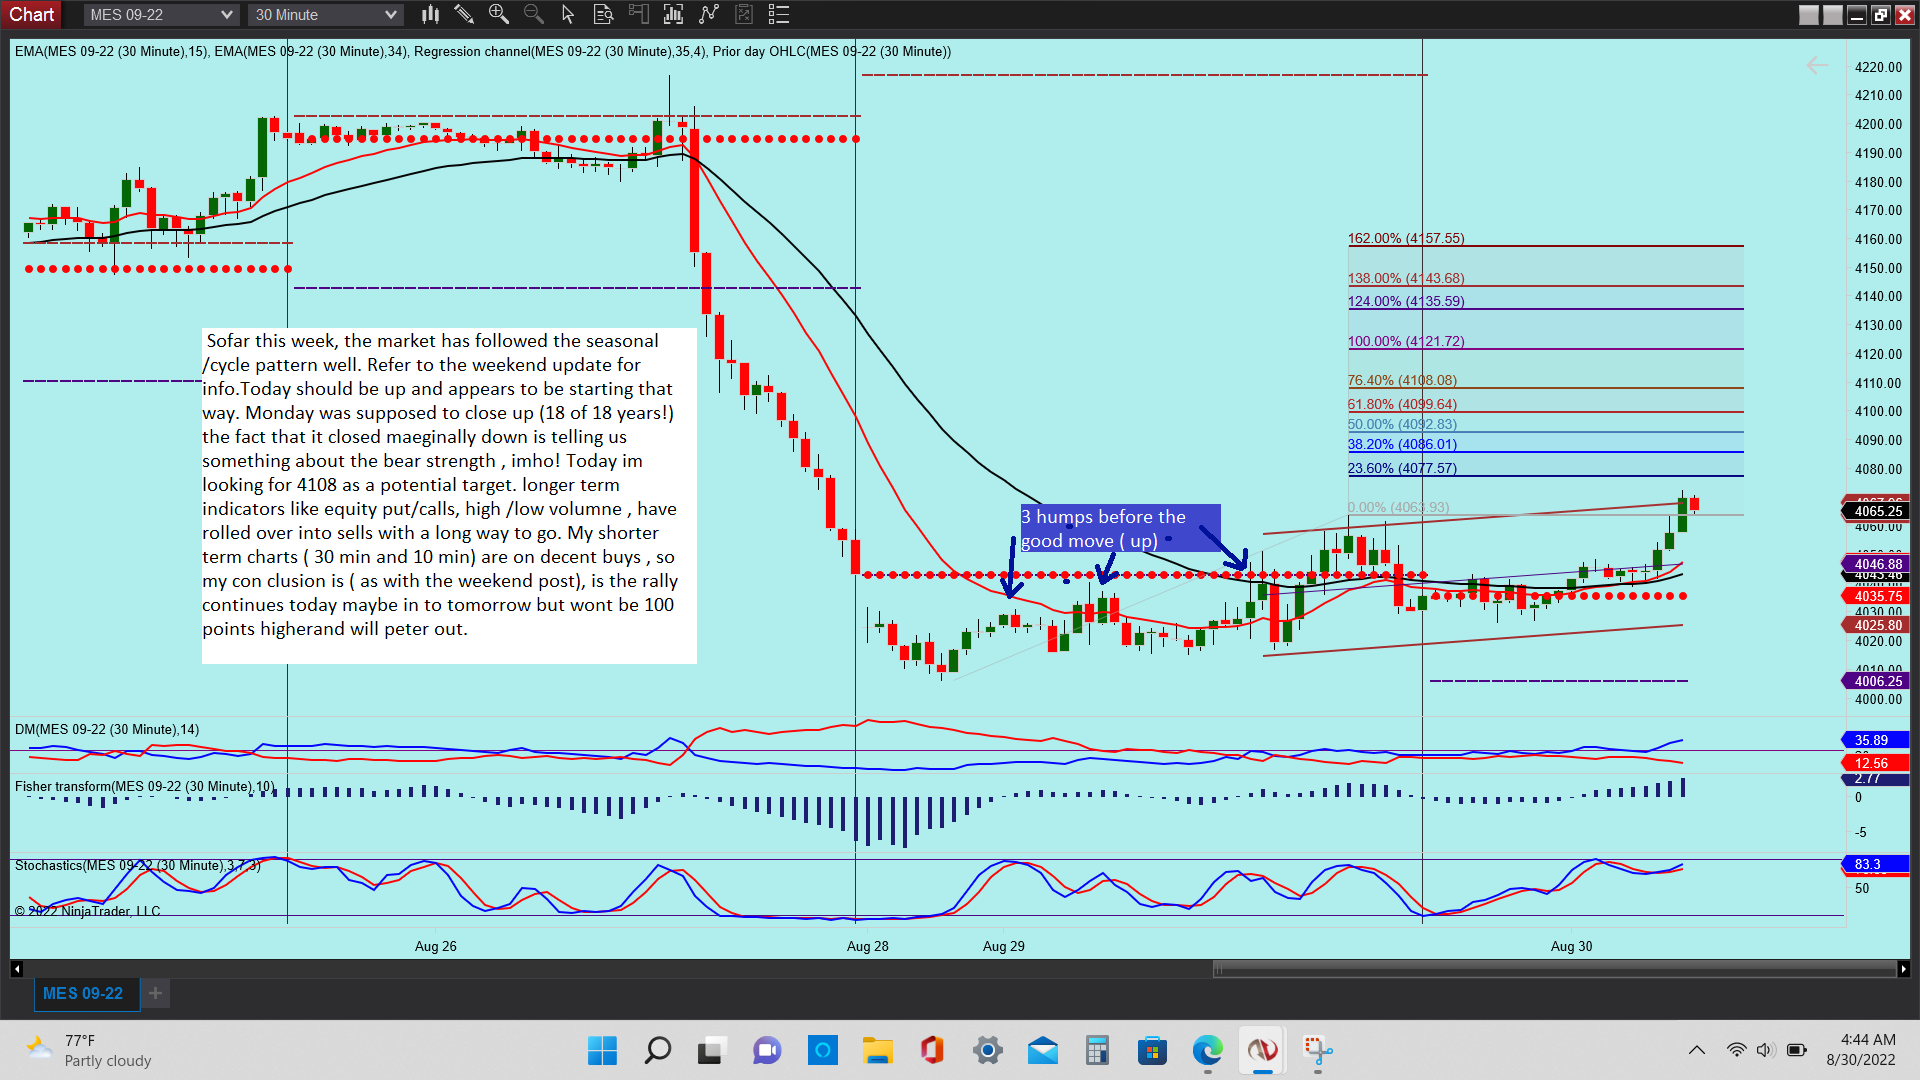
The above article before my comments clearly has today as up! Its by Melanie Schaffer at Benzinga
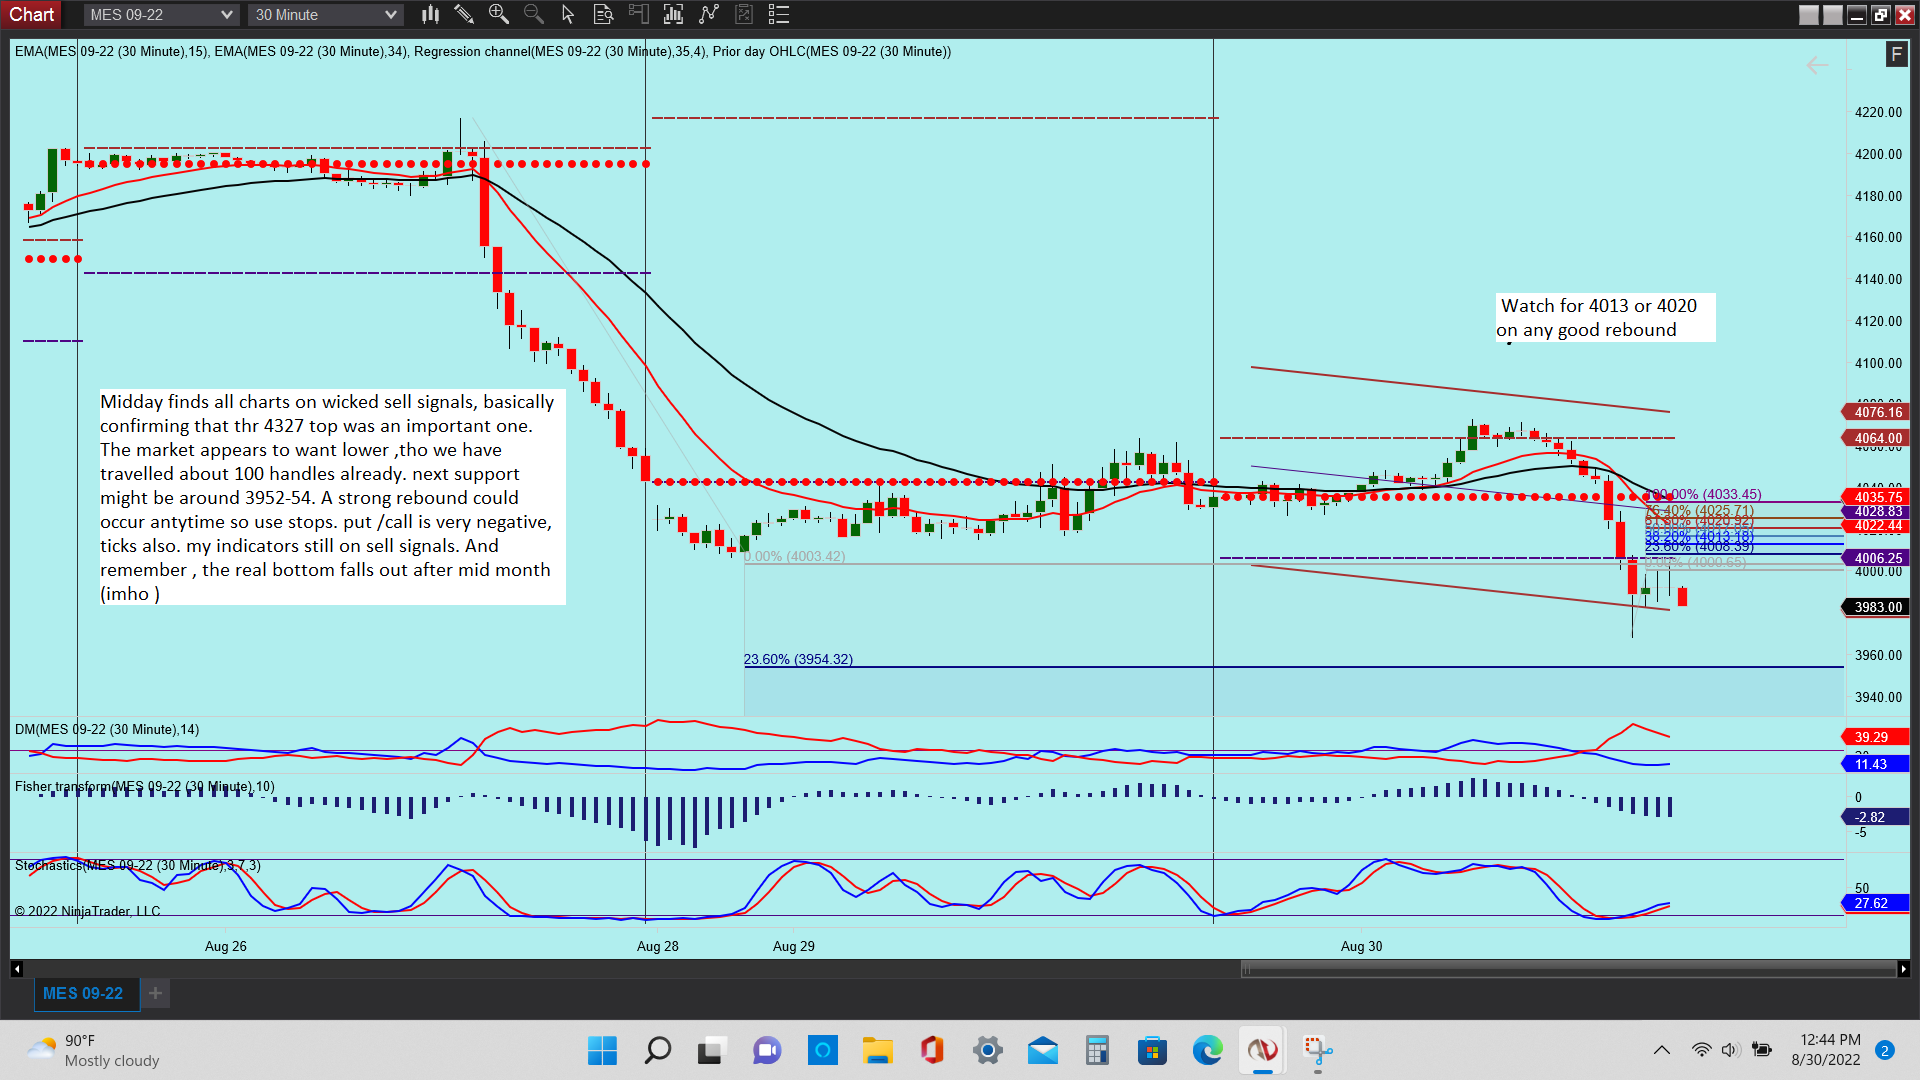
well, so much for an up day! The fact that we broke the 4006 low and could only manage one small rally is very bearish in my book.
Click image for original size
Emini Day Trading /
Daily Notes /
Forecast /
Economic Events /
Search /
Terms and Conditions /
Disclaimer /
Books /
Online Books /
Site Map /
Contact /
Privacy Policy /
Links /
About /
Day Trading Forum /
Investment Calculators /
Pivot Point Calculator /
Market Profile Generator /
Fibonacci Calculator /
Mailing List /
Advertise Here /
Articles /
Financial Terms /
Brokers /
Software /
Holidays /
Stock Split Calendar /
Mortgage Calculator /
Donate
Copyright © 2004-2023, MyPivots. All rights reserved.
Copyright © 2004-2023, MyPivots. All rights reserved.