ES 1-13-23
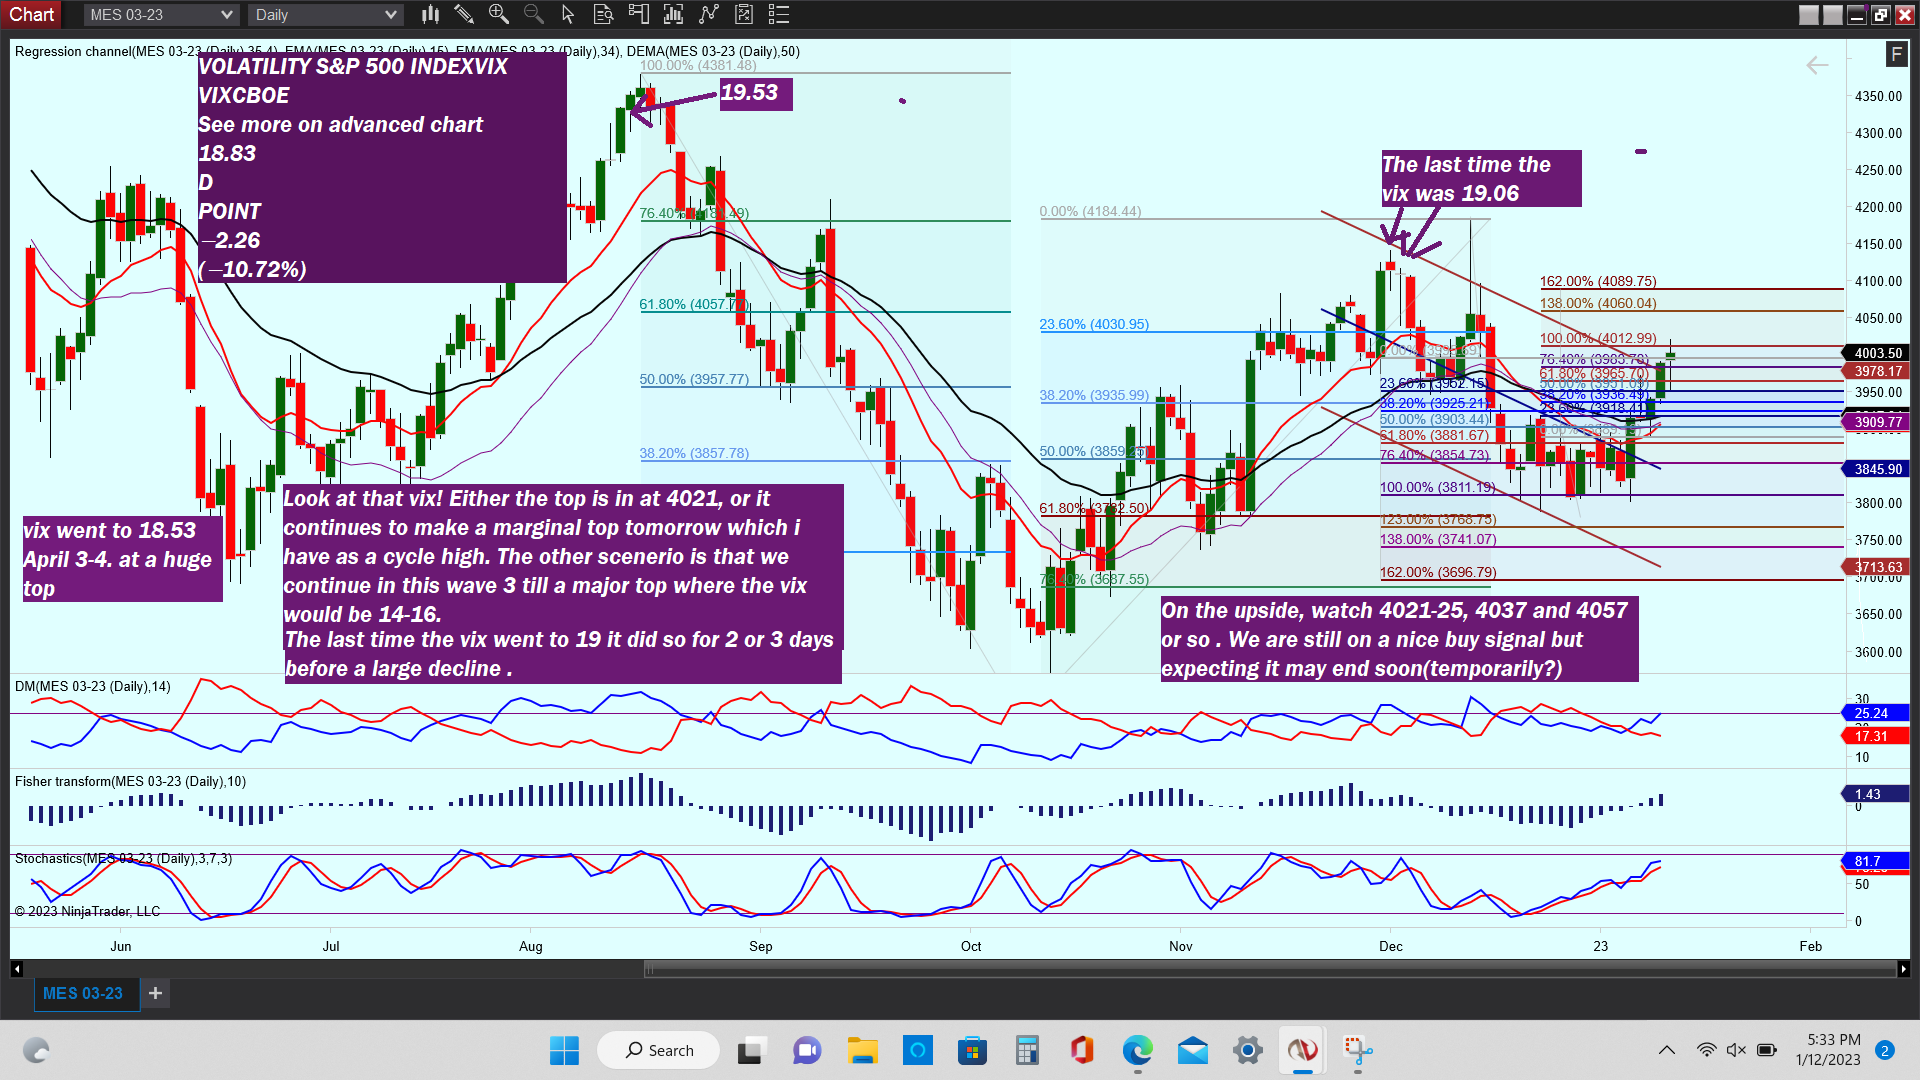
Friday the 13th! Indeed!... This is an important chart study it well!
Click image for original size
Click image for original size
Now regarding the vix, keep in mind its not an exact day indicator but more like a 2-3 day indicator. For instance , on april 4 the close was 18.53 and was the 4th day after the major top. it probably pierced 19 closer to the day of the top but i have no way of knowing as im just looking at closing values. It then proceede to decline over 700 points . Back in Aug it hit 19 and change intraday for i think 3 days before closing Aug 12th at 19 and change. it then declined well over 700 points the third day. So what im saying is we could very well have another day or two of rally or we could start down now. Also , im not expecting a 700 point decline as im very bullish the market right now , im just expecting a deline more like Dec 2nd where it went down around 170 points. in summary i expect a big decine of 150 to 300 point s may be ready to start within the next two days if it hasnt started from 4021.50 already. Of course it couldalways continue on to the 14 level but if that were to happen the decline would probably be huge. Hope this clears things up.
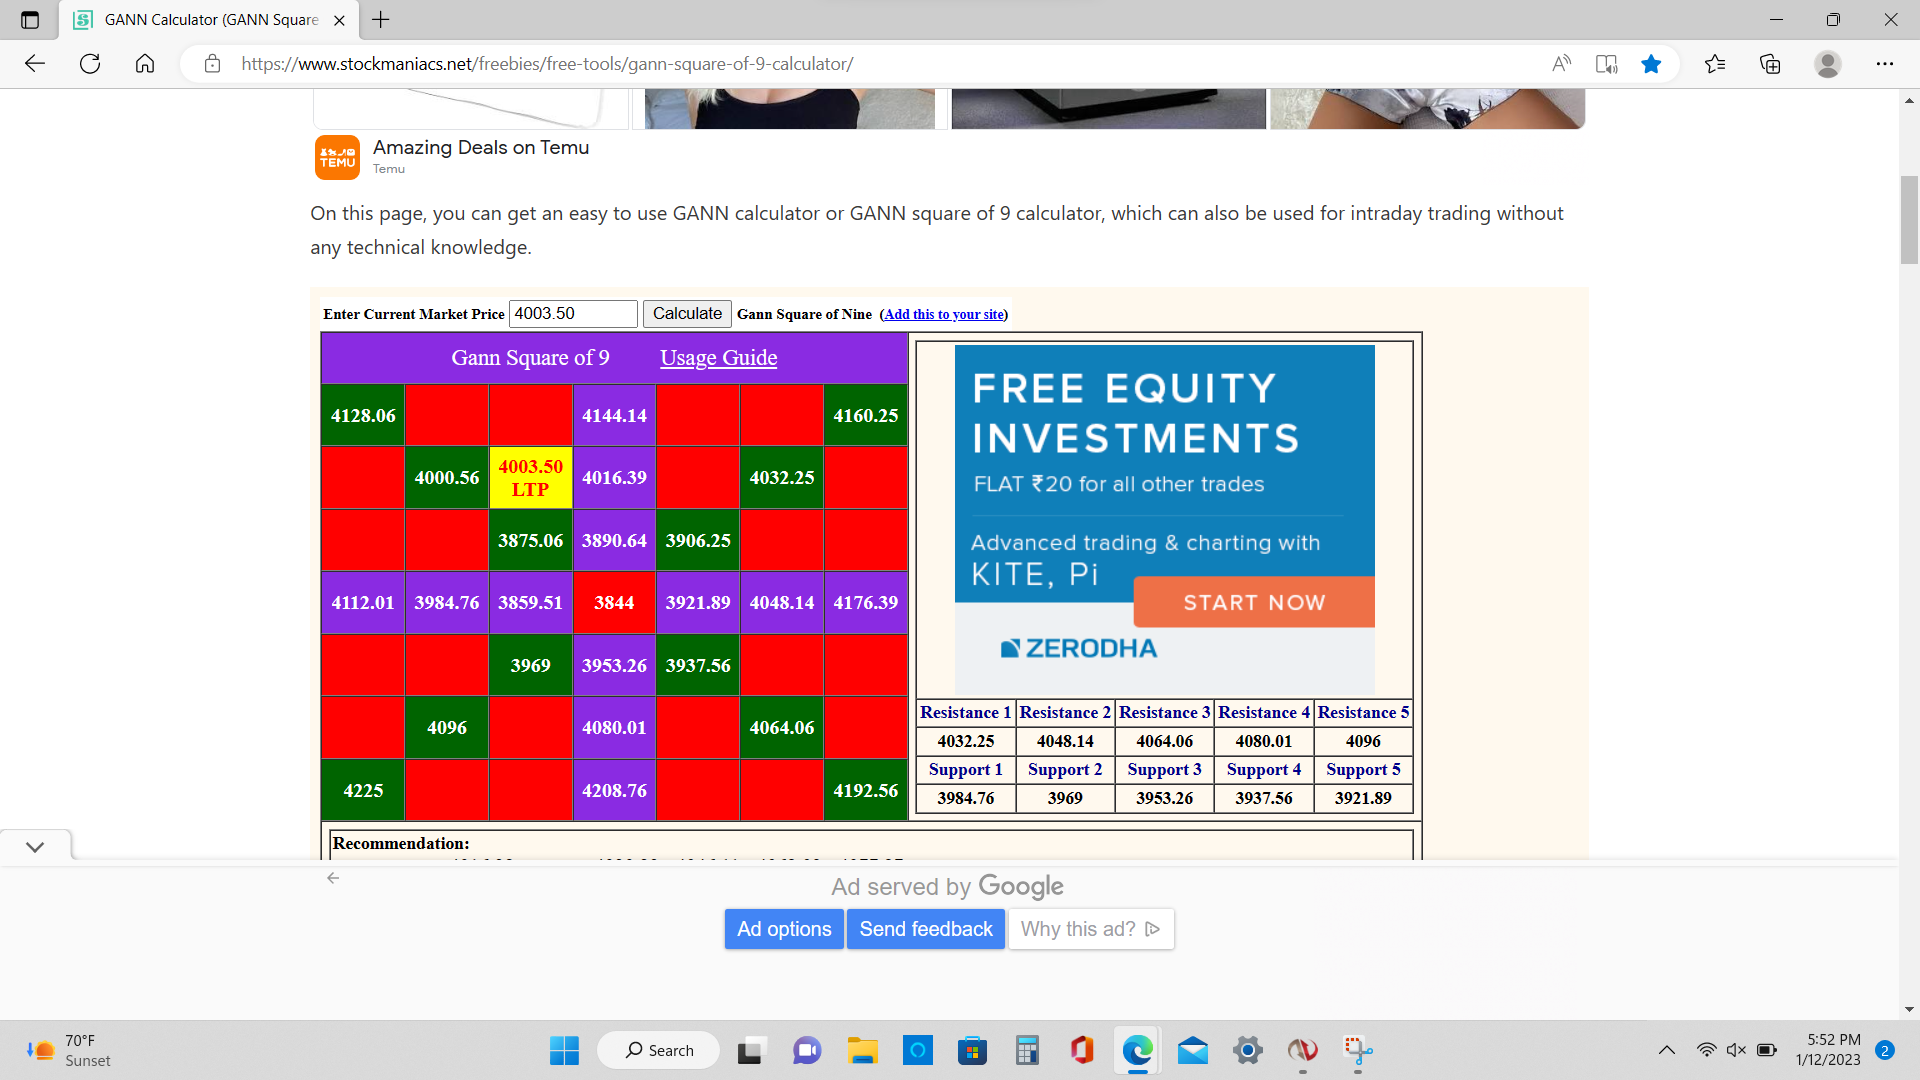
Regarding the Gann table , remember that the signal is given as we pass thru a number. For instance ,if we trade below 4000.50 , Gann would say sell and look for close to 3984.75 ect. They arnt perfect but they are useful.
Emini Day Trading /
Daily Notes /
Forecast /
Economic Events /
Search /
Terms and Conditions /
Disclaimer /
Books /
Online Books /
Site Map /
Contact /
Privacy Policy /
Links /
About /
Day Trading Forum /
Investment Calculators /
Pivot Point Calculator /
Market Profile Generator /
Fibonacci Calculator /
Mailing List /
Advertise Here /
Articles /
Financial Terms /
Brokers /
Software /
Holidays /
Stock Split Calendar /
Mortgage Calculator /
Donate
Copyright © 2004-2023, MyPivots. All rights reserved.
Copyright © 2004-2023, MyPivots. All rights reserved.