Volume Nodes
I'm hoping to get some discussion started on these. Most know them as Points of Control. O/N this chart they are based on volume not time so sometimes the 4 P.M EST close creates the high volume node and sometimes you can see more than one key node. Anyway , it's a start..
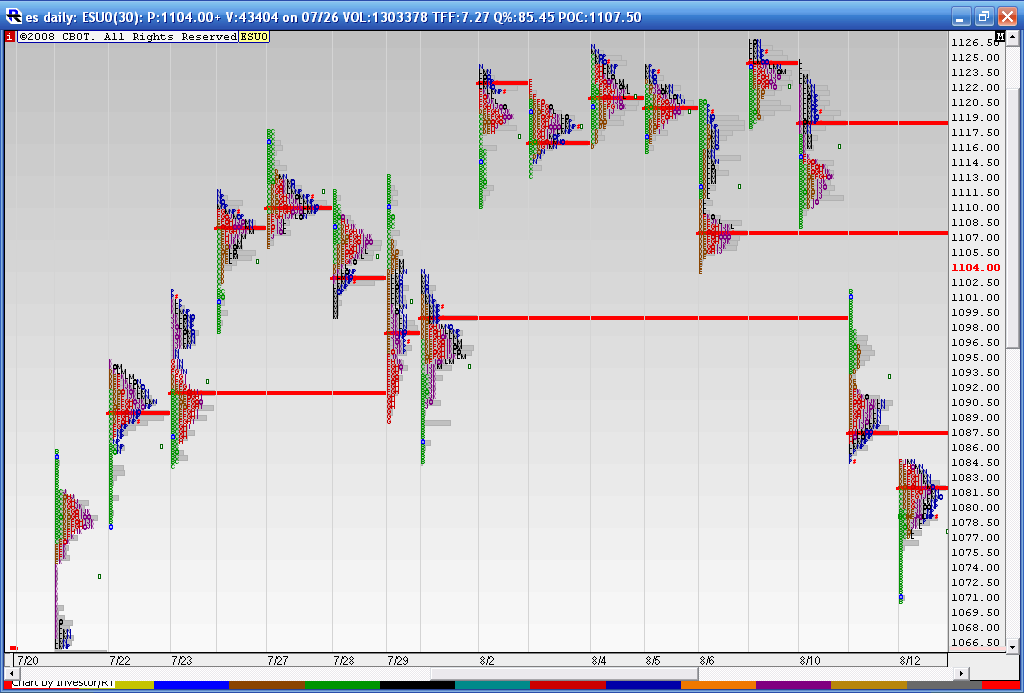
The red line is the peak volume for each day and my software automatically extends them over if the aren't traded through the next day
I had to shrink this down in order to fit these on the chart.
The red line is the peak volume for each day and my software automatically extends them over if the aren't traded through the next day
I had to shrink this down in order to fit these on the chart.
Click image for original size
Thanks DW and glad to "see" you again. I'm leaning heavier towards volume because of my short term work. Most days we see high volume on the vertical scale come in and then SECOND to that price spends TIME around those prices. So this is telling me that the volume comes first and the TIME players are late to the party.
Most MP gurus - Dalton, Jones, Alexander, Benjamin etc..seem to feel that using a fixed time period or look back period is not the way to go. I believe that we need to determine what is Relevant...so what swing highs or lows should we use or should we look at the actual volume above and below the market to see what may have the stronger "Pull". This is interesting because you have more of the "old school" approach and Beyond MP believes that actual volume is the way to go.......
Hopefully we as a forum can fiqure out which one may be better in general and then the end reader can fiqure out what is more useable for their personality.
Of course these are all opinions and nobody is really "right" but hopefully we can all learn something from the journey and respect the differences.
Bruce
Bruce,
You and "Beyond MP" are possibly in the process of rediscovering the wheel - Joe Granville (JG) of OBV fame had us acknowledge that "Volume leads price." Of course JG did not, as far as I'm aware, work at this moment to moment level of trading.
As you know I have some confidence in the real time use of OBV to define probable low risk trade placement at apparent price breakouts.
I don't use MarketDelta but theoretically use of this charting system's "Footprint" should define low risk trade placement at key reference levels.
This could prove to be a valuable forum. I'll be interested in anything you and this forum comes up with.
Sincerely,
DWD.
My trials with Market Delta and actually being able to use it for trading with the footprint have failed miserably. I haven't had much luck with OBV either but then again I'm not a breakout trader. I think part of the problem may actually be the way IB clumps data and volume together...or so I am told....perhaps I'm just dense!!
I don't think this will even come close to reinventing the wheel. It seems that it would be foolish not to use the realtime volume the exchanges provide IF it can be exploited. We just want to concentrate on things that actually work for trading ! There is so much garbage on forums that people put out there that looks great after the day is done and in books etc...it boils my blood.
Elephants( volume)leaves tracks....so perhaps we can follow some elephants.
High Volume Nodes(HVN) are formed at the prices where the highest volume occurs. If you watch these nodes while they are are being formed, you will see that price will almost always revisit these areas.
The time frame being watched makes little difference. Whether watching a daily chart or an intraday time frame these nodes are revisited. I think of them more as "targets"; rather than support and resistance levels.
There some followers of these HVN that create narratives regarding these nodes. To me, these narratives, are created to show the author as having "superior" insight into the inner workings of the market. The only thing these nodes represent is high volume. It is now possible to breakdown volume into some of its components to give greater insight and probable direction to the "story" volume tells.
It should be remembered, it is only in the last few years that this level information has become available. When, I first started trading the electronic future markets, there was only a proxy for volume available. It was "tick volume". The "pits" have never had realtime volume available. Pit-traders could glean a wealth of information from the "action" occurring around them. This, I believe, is the main reason few pit-traders have been unable to make the transition to trading from the screen. It is,now, possible to recreate similar information once gleaned from standing in the "pits" to aid our decision making.(see P.S.)
By the way, to my knowledge, Granville worked with equities. Equities trade much differently than the electronic futures markets due to the fact specialists and market makers are always "in the way". And when he was doing his work realtime volume was not available in those markets. That is the reason for the original Market Profile concepts, a way to simulate volume areas without having the actual information.
"Complex problems-rarely have, simple solutions."
(P.S.- I am not referring to "squawk box" information but rather interrelated market info.)
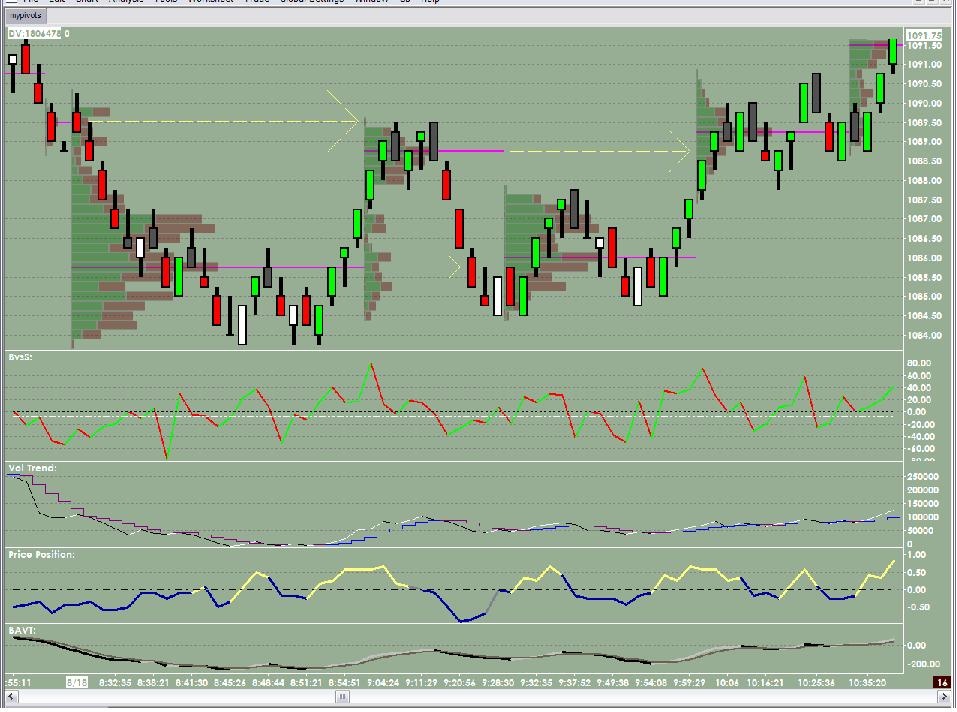
Here is a chart from the morning of 8/18 that illustrates the movement from node to node. You can also see, the info at bottom of the chart, which represents the breakdown of volume into several different parts, which can give a good "heads up" for entry and exits.
Click image for original size
I love these dern volume nodes, they go together with my zones
like beer and hot dogs...
like beer and hot dogs...
Originally posted by redsixspeed
I love these dern volume nodes, they go together with my zones
like beer and hot dogs...
and apple pie and ice cream
I have difficulty reading your charts BeyondMP. I take it that your charts illustrate sequential 30 minute m.profiles. If so they illustrate that 30 minute POCs have the magnet quality and the propensity to act as support in up trends (or resistance in down trends) and that sequential 30 minute POCs in the same direction define he immediate trend.
Just a note to this forum and to BeyondMP. I see BeyondMP continued his valuable observations on a new forum. Possible this was in error or a deliberate posting to restrict discussion to real time, intra-day use of high volume nodes as an aid in day trading.
I think Bruce was interested in high volume nodes in the bigger picture as an aid to day trading. I don't think these subjects are mutually exclusive, in fact are highly complimentary. As with most valid market principles - they should be valid in all time frames.
The beauty of BeyondMP's etc illustrations are that he can give examples frequently because of the small time fractal he uses. The lessons he is so far showing to good effect are transferable conceptually to the use of larger time frame high volume nodes.
Yesterday we opened higher; above the market was an important high volume node in the 1081.00 area. This was not only a "magnet" to prices but it also proved to be effective resistance. On the reversal if last week's low was to fail as support then the next high volume node below was in the 1052.00 area, and below that in the 1044.00 area. We sure made it there today.
BeyondMP's intra day examples will quickly point out the use of high volume nodes in a larger time frame to day trading. Let's consider keeping this together in one forum and see what pearls come forth.
DWD
If someone could give me some advice on how best to post charts so that they are more clear, it would be gratefully appreciated.
I opened the other topic to emphasize the benefit of using volume analysis to help identify entries. Let me know which topic I should use.
It needs to be said, I am a scalper. I prefer to take several high probability trades that give me profits, than to hold out for an across the market win. I need the short term gratification of a winner, it suits my personality and allows me to enter the market all day long. As, all I do is trade during the day, I need a style of trading the keeps me engaged. I know it's not for everyone, but it works for me.
As you can see by my charts, nearly every entry gives me at least 4 ticks on my first leg, which "pays the bills" and the runners provide the "fun".
Originally posted by beyondMP
If someone could give me some advice on how best to post charts so that they are more clear, it would be gratefully appreciated.
How are you capturing the screen shots of your charts? They seem to be scaled down and low quality images.
If you're on a windows computer then one of the easiest ways to capture a chart image (or any image in a window) is to click on that chart (or window) and while holding down the Alt key pres the PrtScn key. This copies the current window (the one with the focus) to the clipboad as an image.
Now open an image processing program such as Paint.Net (free) and press the Ctrl+V key combination and this will paste the image into the program. Now save the image and use the Upload bar under the Message area when you are creating a new topic or replying to one.
lets see if we can get some interest on this.......to start I'd like to know what specifically the lower panes are.....I can't read the chart.......then perhaps we can move to the application of those indicators/volume breakdowns
Originally posted by beyondMP
Here is a chart from the morning of 8/18 that illustrates the movement from node to node. You can also see, the info at bottom of the chart, which represents the breakdown of volume into several different parts, which can give a good "heads up" for entry and exits.
Click image for original size
Emini Day Trading /
Daily Notes /
Forecast /
Economic Events /
Search /
Terms and Conditions /
Disclaimer /
Books /
Online Books /
Site Map /
Contact /
Privacy Policy /
Links /
About /
Day Trading Forum /
Investment Calculators /
Pivot Point Calculator /
Market Profile Generator /
Fibonacci Calculator /
Mailing List /
Advertise Here /
Articles /
Financial Terms /
Brokers /
Software /
Holidays /
Stock Split Calendar /
Mortgage Calculator /
Donate
Copyright © 2004-2023, MyPivots. All rights reserved.
Copyright © 2004-2023, MyPivots. All rights reserved.