Single Prints Forward Test - May 2005
I have been trying to back test single prints as high probability reversal areas but have been unable to do it so far. As a second prize I'm toying with the idea of forward testing this in simulated real-time using the ER2 contract and testing during the month of May 2005.
So far I've come up with the following rules. Jump in and add or question a rule if you wish:
So far I've come up with the following rules. Jump in and add or question a rule if you wish:
- The single print must be less than a month old to be used.
- The single print must be a confirmed single print.
- The entry price is one tick inside the single print and an entry will only be recorded if the price touches the single.
- A stop of one handle will be used.
- 4 contracts will be traded.
- Partial profits will be taken at 1, 2, 3, and 4 points.
- Commissions will be $5 per contract.
- Stop will be moved to break even after first partial profit has been taken.
- Stop will not be trailed after moved to break even.
- No re-entries if stopped out but re-entries always taken if all 4 contracts are taken off profitably and re-entry is then only allowed on that day. (This is logical because single tick will not be there on subsequent days.)
- All single trades will be taken irrespective of other news items or announcements that are being made at that point.
- If multiple singles created in same day or time period then all of them will be traded using the same stops and targets and rules.
- No overnight carry. Any open contracts are closed out at the last traded price (not the settlement price) that is traded during RTH which in this case is usually at 16:14:59 or 16:15:00 EST. Although you would not be able to implement this in real trading it appears to be the fairest way to measure this strategy. In reality you will close the trade before this time and get a slightly more or less favorable price.
I can see some short comings in this strategy already. I think that I will continue to run this test through to the end of the month and then revise the rules based on what I/we've learnt and then test the revised strategy in the following month.
quote:
Yes, I'm always watching the rotation factor. I have a little utility that pops up the Rotation Factors (that I'm watching) at the end of each half hour and sounds an audible alarm and lets me know what the Rotation Factors are. That way I'm always aware of what the RF's are at the end of each half hour and am always aware of what's happening. But I don't check them before I trade because I just refresh my mental image of the market w.r.t. the RF's at each half hour. Here is an example of what the RFTool shows me:
It also keeps me abreast of the RF's in multiple markets at the same time so I can see if the RF in the ES is going up and in the ER2 and YM might be going down... which is obviously useful info.
Hope this helps.
Guy
Hi Guy,
Thanks for answering my queries.
In the test so far what was the RF for each trade and how did it help you take a trading decision? Would it have kept you out of a losing trade? Did the RF of other markets give you any indication of the direction?
quote:
Originally posted by BUZZ200
Hi Guy,
Thanks for answering my queries.
In the test so far what was the RF for each trade and how did it help you take a trading decision? Would it have kept you out of a losing trade? Did the RF of other markets give you any indication of the direction?
Hi Buzz,
Because these are paper trades I'm not recording any other specific factors apart from the arbitrary comments that I make in the notes column of the spreadsheet.
However, recording the RF of the traded market (ER2 in this case) and other related markets at the time of entry may well be a usefull bit of information.
There is anther bit of information that I have been thinking about recording with the trade and that is the age of the single print that is traded to the decimalized day. The theory is that more recent single prints are more effect levels to trade off. It would be interesting to see if that theory is true.
And yet another piece of information would be an "order created" column. This is the order in which the single was created on the day that it was created. Most of the singles would be 1's because they were the first singles created and are supposedly the most effective but you would also have 2nd and 3rd singles created during the day that could be monitored.
I guess that those 3 bits of info can be added to next month's tests and we can then sort and select on those columns to see the effectiveness of that extra info.
Thanks for your ideas - valuable.
Regards,
Guy
16 May Update:
We had a short trade at 15:45 EST at 591.7 which was subsequently stopped out for a loss of $420. We have not defined an "entry before this time" rule so this trade has been recorded. Once we've collected enough data we can sort/select by time of entry and see if there is an appropriate cut-off time.
The spreadsheet has been updated.
An assumption that I have made, but I'm not sure if it was conveyed in the rules above, is that all positions are closed out by the end of the day and it is assumed that the position is closed out at the last price traded if still open at that point.
New single created at 589.9
This single has been added to the White Board.
You will notice that there are a number of singles above us on the White Board but all of these are too old to use according to the rules that we've set out in this months strategy test. One of the rules is that the single print must be less than (or equal to) one month old. Having said that we still haven't defined that very well so I'm going to clarify it here. The single must have been made in one of the previous 20 trading sessions in order to qualify as a single print to be used in this strategy.
Cumulative profit now at $360
We had a short trade at 15:45 EST at 591.7 which was subsequently stopped out for a loss of $420. We have not defined an "entry before this time" rule so this trade has been recorded. Once we've collected enough data we can sort/select by time of entry and see if there is an appropriate cut-off time.
The spreadsheet has been updated.
An assumption that I have made, but I'm not sure if it was conveyed in the rules above, is that all positions are closed out by the end of the day and it is assumed that the position is closed out at the last price traded if still open at that point.
New single created at 589.9
This single has been added to the White Board.
You will notice that there are a number of singles above us on the White Board but all of these are too old to use according to the rules that we've set out in this months strategy test. One of the rules is that the single print must be less than (or equal to) one month old. Having said that we still haven't defined that very well so I'm going to clarify it here. The single must have been made in one of the previous 20 trading sessions in order to qualify as a single print to be used in this strategy.
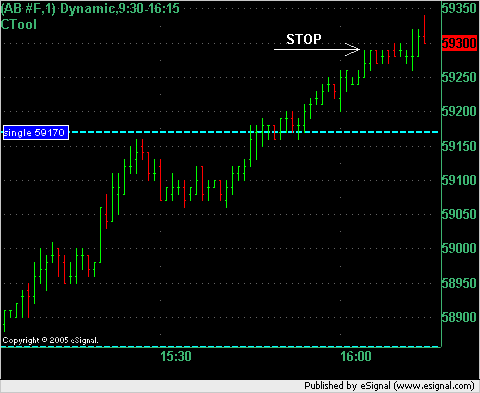
16 May Update (cont.)
Here is a chart of today's single print trade:
Here is a chart of today's single print trade:
Click image for original size
:
17 May 2005: intraday update
Long at 590.0 at 9:39 EST with 1 contract off at 591 and another at 592 and the stop moved to breakeven at 590 which was hit at 10:16 EST.
Profil on trade after commissions was $280.
spreadsheet updated
Cumulative profit now $640
Long at 590.0 at 9:39 EST with 1 contract off at 591 and another at 592 and the stop moved to breakeven at 590 which was hit at 10:16 EST.
Profil on trade after commissions was $280.
spreadsheet updated
One thing I never mentioned was the starting capital that this test would need:
I assume a starting margin of $5,000 per contract and as we're trading 4 contracts per trade that means we need $20,000 to start this project.
I assume a starting margin of $5,000 per contract and as we're trading 4 contracts per trade that means we need $20,000 to start this project.
17 May 2005: End of day update
I was away for the rest of the trading day but what I can see at the end of the day is that there weren't any other single trades but a new single print was formed at 592.8 in the N bracket.
I've updated the White Board and noted that this single that we formed in the N bracket is the only valid single that we can use for single print strategy at the moment because all the other single prints (on the White Board) are more than 20 trading sessions old and so for this particular set of rules that we are using they are too old to qualify anymore as single prints.
18 May 2005: Update
No singles trades today.
Do you remember this image that I posted at the beginning of this thread?
It shows a single at 608.3 from the K bracket on 13 April. This single would have worked out today and made us some money but as I stated in the rules, we are only taking single trades based on singles that were created in the last 20 trading sessions and this falls before that time period and I'm NOT going to bend the rules to manipulate the testing results. We want to know how well this will perform based on the rules that I have set out. However, it is equally important to note situations such as this as they may help us modify the rules in a subsequent test or in live trading to our advantage and profit. Remember that this forward testing is NOT out to prove that this strategy works it is here to test IF this strategy works with the rules we have created.
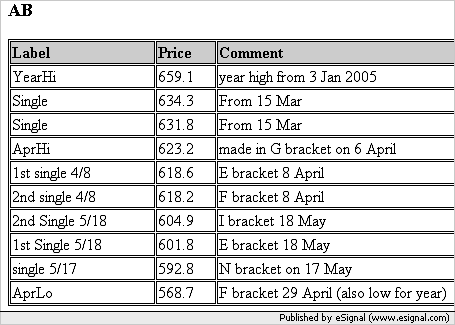
Today we created 2 new singles as follows:
1st Single 5/18 601.8 (E bracket 18 May)
2nd Single 5/18 604.9 (I bracket 18 May)
You can find these in the White Board. If you're using the CTool from the ToolPack for eSignal then this indicator will pick up the values fromt he White Board and put them on your chart for you. The C in CTool stands for "Custom". It allows us to share the work load of marking areas on charts that we believe will form resistance and support. It means that 1 person can enter the single (or other number) onto the web page and everyone using the CTool can see it on their chart.
No singles trades today.
Do you remember this image that I posted at the beginning of this thread?
Click image for original size
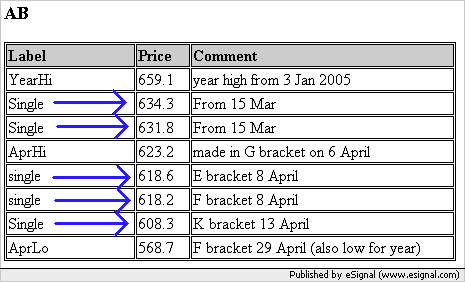
It shows a single at 608.3 from the K bracket on 13 April. This single would have worked out today and made us some money but as I stated in the rules, we are only taking single trades based on singles that were created in the last 20 trading sessions and this falls before that time period and I'm NOT going to bend the rules to manipulate the testing results. We want to know how well this will perform based on the rules that I have set out. However, it is equally important to note situations such as this as they may help us modify the rules in a subsequent test or in live trading to our advantage and profit. Remember that this forward testing is NOT out to prove that this strategy works it is here to test IF this strategy works with the rules we have created.
Today we created 2 new singles as follows:
1st Single 5/18 601.8 (E bracket 18 May)
2nd Single 5/18 604.9 (I bracket 18 May)
You can find these in the White Board. If you're using the CTool from the ToolPack for eSignal then this indicator will pick up the values fromt he White Board and put them on your chart for you. The C in CTool stands for "Custom". It allows us to share the work load of marking areas on charts that we believe will form resistance and support. It means that 1 person can enter the single (or other number) onto the web page and everyone using the CTool can see it on their chart.
Here is the White Board snapshot as it is now:
Click image for original size
The White Board is a discontinued indicator because its functionality was automated through the use of the DVATool which is much faster and more reliable in managing Single Prints - which is primarily what the White Board was used for.
Emini Day Trading /
Daily Notes /
Forecast /
Economic Events /
Search /
Terms and Conditions /
Disclaimer /
Books /
Online Books /
Site Map /
Contact /
Privacy Policy /
Links /
About /
Day Trading Forum /
Investment Calculators /
Pivot Point Calculator /
Market Profile Generator /
Fibonacci Calculator /
Mailing List /
Advertise Here /
Articles /
Financial Terms /
Brokers /
Software /
Holidays /
Stock Split Calendar /
Mortgage Calculator /
Donate
Copyright © 2004-2023, MyPivots. All rights reserved.
Copyright © 2004-2023, MyPivots. All rights reserved.