Channel surfing the ES
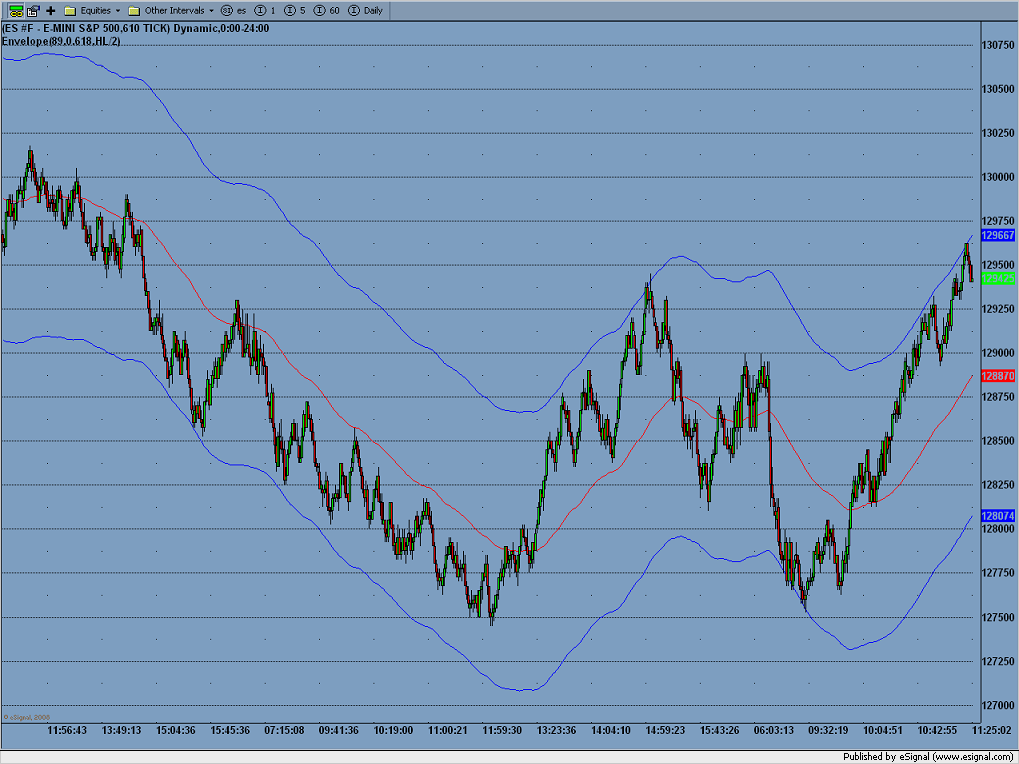
This is by no means a buy/sell black box system but is a set of EMA parameters that alert me to a coming movement. Picture it like this the red line is the pivot point, the blue are the extreams like a dog on a rubber leash it'll go back and forth. from blue to red to red....
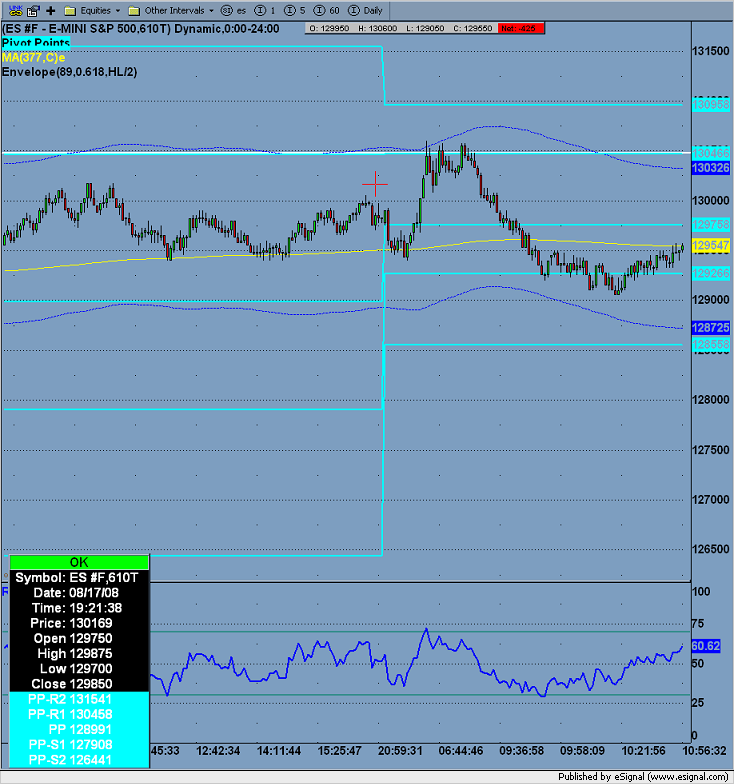
Parameters are 610 tick chart 89 period EMA with a H/L divided by 2 EMA, off set .618% enevolpe....
I am still searching for a good enevolpe for my bread and butter 30min ES chart.
Parameters are 610 tick chart 89 period EMA with a H/L divided by 2 EMA, off set .618% enevolpe....
I am still searching for a good enevolpe for my bread and butter 30min ES chart.
Click image for original size
Not sure what the average number of contracts per trade is but you'd have to multiply your tick chart by that number to get the equivalent volume chart.
As a quick explanation: If there are exactly 2 contracts per trade then a 100T chart would represent 200 contracts per bar and that would equate to a 200V chart.
As a quick explanation: If there are exactly 2 contracts per trade then a 100T chart would represent 200 contracts per bar and that would equate to a 200V chart.
Thanks DT. That proves problematic in that as retail traders we don't have access to at the book data. The numbers shown in 1.5 and even 2.0 insofar as I know are retail and market maker specific.
How would you suggest placing it all theoretically correct?
As a side note I swear by the 10000V in the interim.
How would you suggest placing it all theoretically correct?
As a side note I swear by the 10000V in the interim.
Just take the total ticks in your time period (I use 9:30 to 16:00 ET) and divide the total volume during the same period by the total ticks to come up with your multiplier.
I use GSTrader platform. So how do I go about offsetting 89 period EMAs. All I have is a period setting option for moving averages with flexibility to use open/ close/ low/high as source.
"@kbi - Does your charting platform allow you to vertically offset your lines? If so then add 2 more EMA lines with the same settings and vertically offset them, one up and one down, using the 0.618% that CharterJoe is using."
"@kbi - Does your charting platform allow you to vertically offset your lines? If so then add 2 more EMA lines with the same settings and vertically offset them, one up and one down, using the 0.618% that CharterJoe is using."
If the only option that you have is the period option then you probably don't have the offset option. Ask the support guys at GSTrader if you can do that and/or point them at this topic if they don't understand what you're looking for. Show them the chart that CharterJoe created.
With respect to DT I just can't bring myself to do away with the 10000V chart.
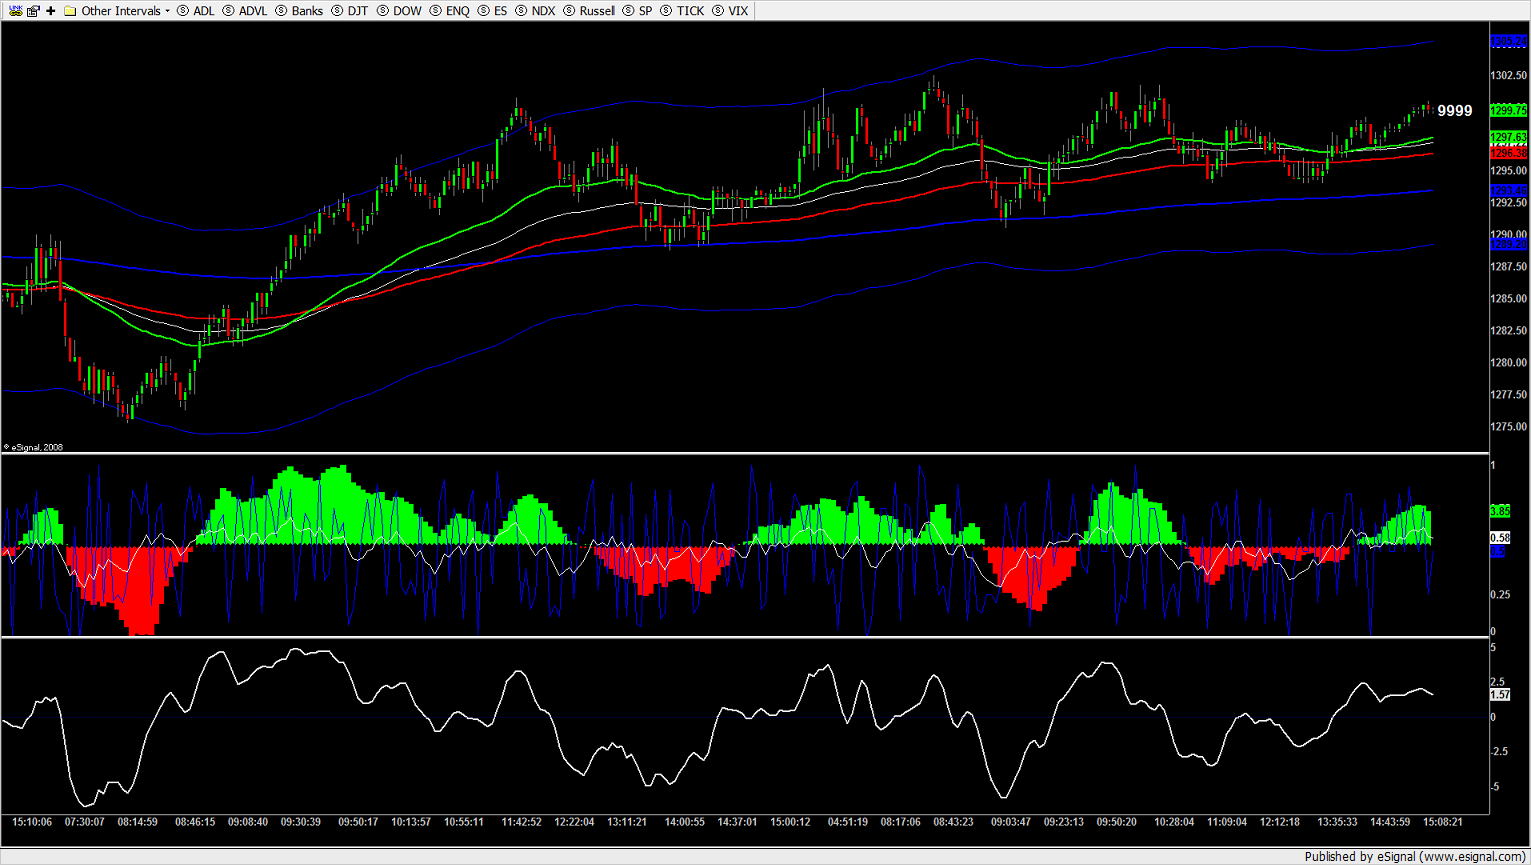
55 EMA: green
144 EMA: red
377 EMA: blue
Envelope pivot: silver
.618 overbought and oversold extremes: blue thin lined
S&P price oscillator overlayed on the squeeze.
MACD underneathe.
There's nothing not being resisted or supported, and that, my friends, is art.
Thanks again, Joe.
55 EMA: green
144 EMA: red
377 EMA: blue
Envelope pivot: silver
.618 overbought and oversold extremes: blue thin lined
S&P price oscillator overlayed on the squeeze.
MACD underneathe.
There's nothing not being resisted or supported, and that, my friends, is art.
Thanks again, Joe.
Click image for original size
Emini Day Trading /
Daily Notes /
Forecast /
Economic Events /
Search /
Terms and Conditions /
Disclaimer /
Books /
Online Books /
Site Map /
Contact /
Privacy Policy /
Links /
About /
Day Trading Forum /
Investment Calculators /
Pivot Point Calculator /
Market Profile Generator /
Fibonacci Calculator /
Mailing List /
Advertise Here /
Articles /
Financial Terms /
Brokers /
Software /
Holidays /
Stock Split Calendar /
Mortgage Calculator /
Donate
Copyright © 2004-2023, MyPivots. All rights reserved.
Copyright © 2004-2023, MyPivots. All rights reserved.