Comments on Market Review
Hi everyone, this thread will not be locked like the Market review so you can post your comments about my reviews or share your views on the market.
Thanks
Laurent
Thanks
Laurent
I'm looking forward to your posts Larry...I've always been skeptical of Waves etc so it would be nice to see someone who can actually use them..and thanks for those great charts too
Bruce
Bruce
Larry,
Can you explain your "clearly see 7 waves down"? Are you including the corrective waves? This is the first time I heard someone using more than 5 waves. Thanks.
btw, Thanks for the bio Larry. Hope to get out of my full time job one day.
Can you explain your "clearly see 7 waves down"? Are you including the corrective waves? This is the first time I heard someone using more than 5 waves. Thanks.
btw, Thanks for the bio Larry. Hope to get out of my full time job one day.
quote:
Originally posted by BruceM
I'm looking forward to your posts Larry...I've always been skeptical of Waves etc so it would be nice to see someone who can actually use them..and thanks for those great charts too
Bruce
larry
if you would be so kind, maybe you could explain to our good friend bruce what some of the acronyms are and what they mean on the charts you use to depict and annotate the elliot waves
we've seen you depict such acros as ts1/2/3 and dp and others - im sure that would be helpful to bruce and others to follow along as to the whys you are labeling your waves... also, it would lend credence to skepticism
im aware this is an educational request but i believe it would be helpful to traders not familiar to your lingo on your excellent charts
thanks in advance larry
ciao
g
The following comments come from my daily report on my nascent blog at http://ddaytrader.wordpress.com/
As you will see, My count on the daily SPX and the 15 minute ES are, for the most part, in complete agreement with Laurent.
My preferred count suggests we will indeed take out the 1217 low, perhaps as early as tomorrow. However, as Laurent noted, unless and until 1217 breaks, the upside possibility is alive for a BIG C rally.
A break and hold of 1217 should see some support at 1200, but ultimately that support should give way to a further drop to the 1169-1186 area. If I were asked to tighten that potential support zone, I would contract it to 1178.27-1182.66.
Here are my comments and charts:
Both of the wave counts I’ve been working appear to remain viable, though the preferred count seems to be more likely to be the one playing out.
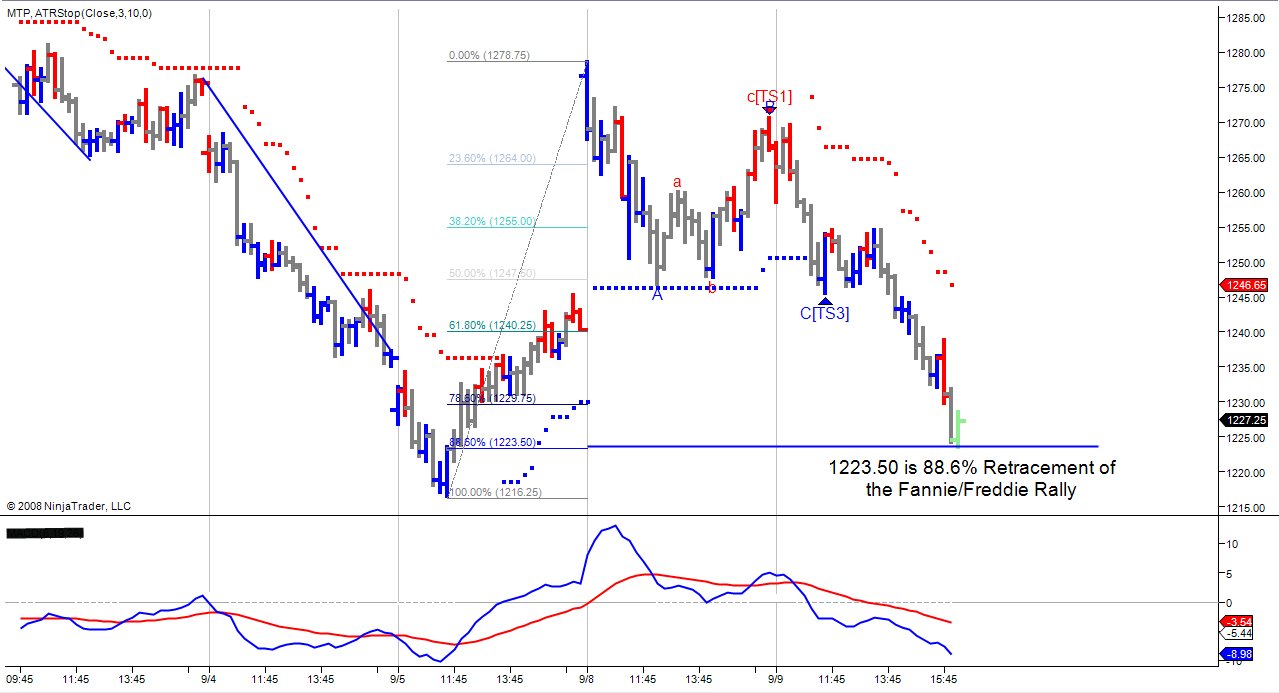
The preferred count on the daily SPX has last week’s 1217 low as the end of a wave 3 down, and the Frannie/Freddie rally as the whole of a wave 4 up, and we are now in a wave 5 down that will carry the cash SPX down to the 1170 area.
The alternate count remains viable as well, however. This count identifies the 1217 low as the bottom of a Big Wave B, with the FannieFreddie rally as the entirety of a wave 1 or A of a Big Wave C up that will carry the SPX up to 1306-1340ish. The SP e-mini (ES U8 - SP e-mini September contract) traded to a 1223.50 low, which is the 88.6% retracement of the FranniFreddie rally. This would be a logical place from which the market could stage the next rally leg up of a Big C up. In Fact, the SP’s can fall back to 1217 (1216.50 ES e-mini) without completely eliminating the alternative count.
In addition to the daily SPX chart, I have attached the 15 minute ES e-mini through today’s day session close. This is my main trading chart for daytrading purposes.
As you will see, My count on the daily SPX and the 15 minute ES are, for the most part, in complete agreement with Laurent.
My preferred count suggests we will indeed take out the 1217 low, perhaps as early as tomorrow. However, as Laurent noted, unless and until 1217 breaks, the upside possibility is alive for a BIG C rally.
A break and hold of 1217 should see some support at 1200, but ultimately that support should give way to a further drop to the 1169-1186 area. If I were asked to tighten that potential support zone, I would contract it to 1178.27-1182.66.
Here are my comments and charts:
Both of the wave counts I’ve been working appear to remain viable, though the preferred count seems to be more likely to be the one playing out.
The preferred count on the daily SPX has last week’s 1217 low as the end of a wave 3 down, and the Frannie/Freddie rally as the whole of a wave 4 up, and we are now in a wave 5 down that will carry the cash SPX down to the 1170 area.
The alternate count remains viable as well, however. This count identifies the 1217 low as the bottom of a Big Wave B, with the FannieFreddie rally as the entirety of a wave 1 or A of a Big Wave C up that will carry the SPX up to 1306-1340ish. The SP e-mini (ES U8 - SP e-mini September contract) traded to a 1223.50 low, which is the 88.6% retracement of the FranniFreddie rally. This would be a logical place from which the market could stage the next rally leg up of a Big C up. In Fact, the SP’s can fall back to 1217 (1216.50 ES e-mini) without completely eliminating the alternative count.
In addition to the daily SPX chart, I have attached the 15 minute ES e-mini through today’s day session close. This is my main trading chart for daytrading purposes.
Click image for original size

Click image for original size
quote:
Originally posted by gio5959
quote:
Originally posted by BruceM
I'm looking forward to your posts Larry...I've always been skeptical of Waves etc so it would be nice to see someone who can actually use them..and thanks for those great charts too
Bruce
larry
if you would be so kind, maybe you could explain to our good friend bruce what some of the acronyms are and what they mean on the charts you use to depict and annotate the elliot waves
we've seen you depict such acros as ts1/2/3 and dp and others - im sure that would be helpful to bruce and others to follow along as to the whys you are labeling your waves... also, it would lend credence to skepticism
im aware this is an educational request but i believe it would be helpful to traders not familiar to your lingo on your excellent charts
thanks in advance larry
ciao
g
Yes of course that is why I said if you have any questions not to be shy and asked about that.
OK I will start by saying that EW has stated thast an impulse wave has 5 waves but you can also have extensions in one of the wave so if 1 wave inside the 5 waves has also 5 waves we will have a total of 9 waves so 5,9 or 13 waves are considered an impulse wave if we have 3,7 or 11 waves this can be considered a corrective pattern meaning that once completed the market should go in the opposite direction. This is EW in a perfect world, but I have found out that this is not always the case as very often the market moves in ABC pattern instead of impulsive ones so what I try to do is to spot a potential ABC, so I always label the first 3 wave 1A 2B and 3C as this is the minimum we should have each of these waves can be made in 3,5,7,9,and 13 waves but I don't want to elaborate too much on that. What is important is that I always try to spot where we may have a corrective pattern ending so we can have an entry point to take a trade. One of the thing I use to spot these possible entries are the use of Fibonnaci numbers that I use for retracements and projections of waves I won't enter too much in details once again as it would be too long. I also have an addon in my Ninjatrader to help me spot the waves and it also detects possible ABC's, the reason why you sometimes see TS1 TS2 TS3 or TS4 it also use sanother concept call DP (Decision Point) we can draw them manually with the software these are the green boxes. So withthe help of all these tools, EW and TTT book I try to spot the best places to take a trade.
I hope that will help you to understand a bit more about how I can spot a good trade, I will try to explain gradually all these things every time a post a chart and do not hesitate to ask questions as it would be impossible to explain everything in one post.
Regards
Laurent
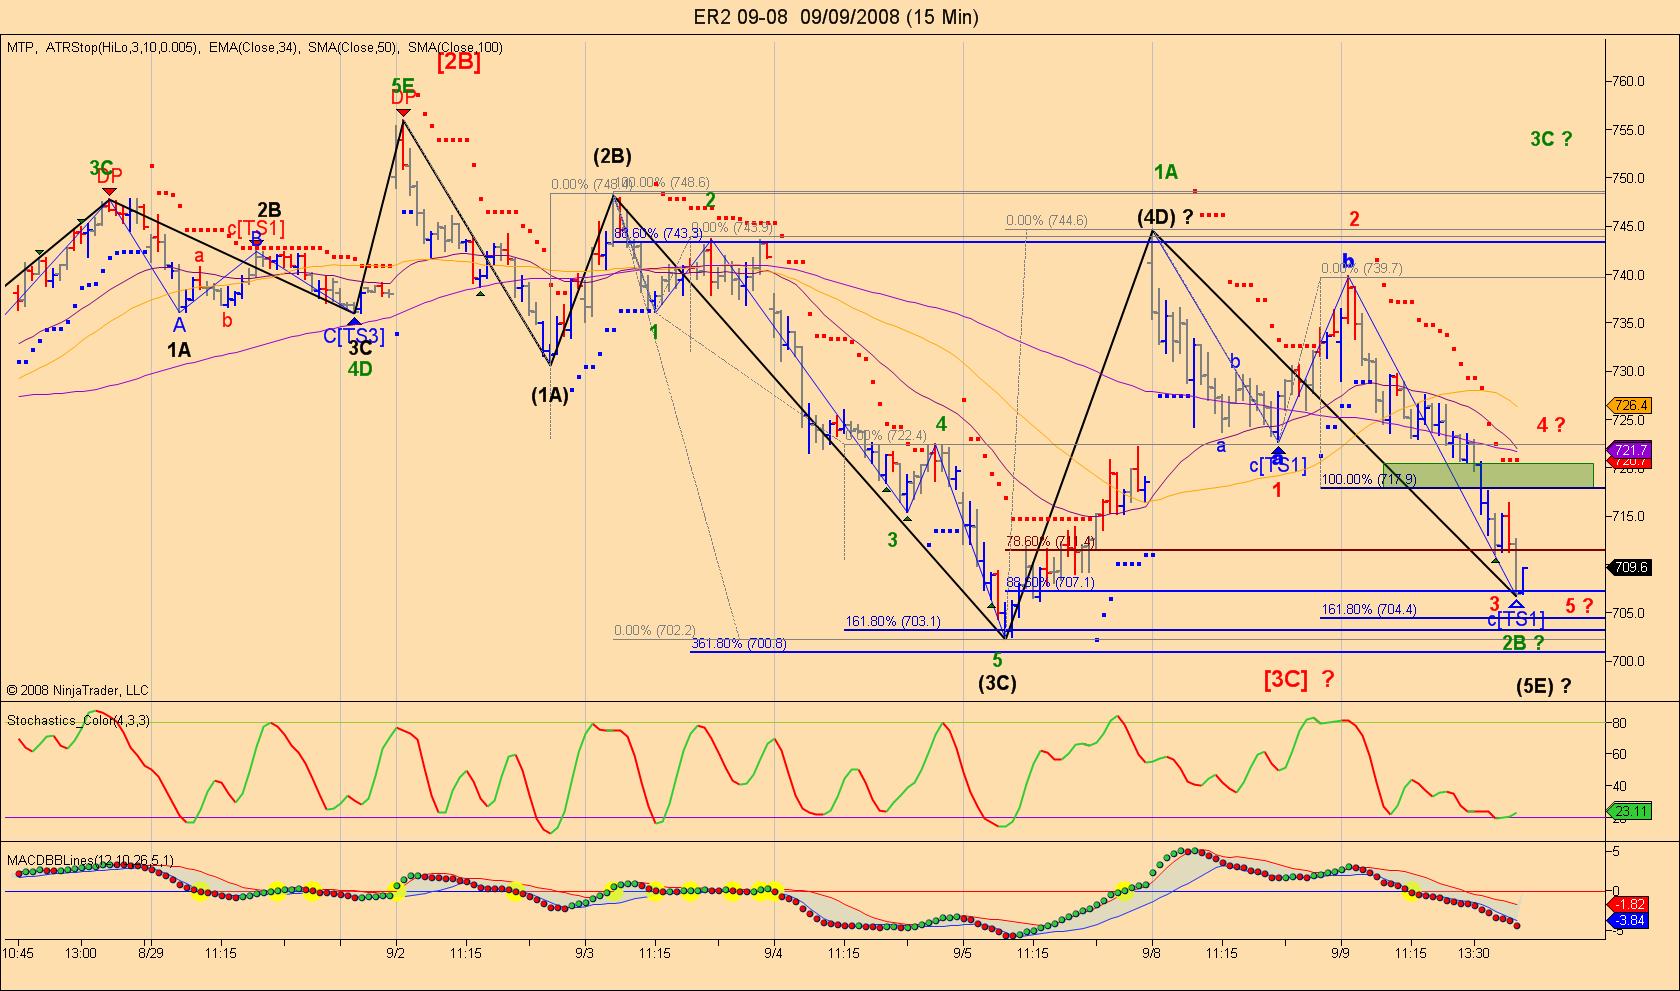
I will try to explain EW by using the ER2 15 min chart as we have a better wave pattern on it.
Starting from the top at 755.9 we can clearly see that we had 3 waves down labeled in black (1A) (2B)and (3C) we can clearly see that wave (3C) had 5 waves (green label)in it from the low of wave (3C) at 702.2 we went to the wave (4D) the reason why I called it 4D instead of 4 it is because the wave 4 should not go higher then the low of wave 1 in this case it was 730.6 so we went higher but did not broke the wave (2B) so we could still make a lower low for a potential wave (5E) down. From the top of wave (4D) we can now see that we have 3 waves down labeled in red so if we are indeed in wave 5 we should go lower then wave (3C) but wave (5E) if we go lower could have a minimum of 5 waves down as we have allready 3 then we could make 4 then 5 lower. That was one possible count but we could also have a corrective pattrn that ended at the low of wave (3C) 702.2 if that's the case we would have the first wave up 1A (green label) the low we made today at 706.7 would be wave 2 as it needed 3 waves down for a b wave (called 2B on the chart) as this a corrective pattern so if this is the case the market should go up all day tomorrow as we would be in a wave 3C.
I hope these explanations will help you understand better.
Click image for original size
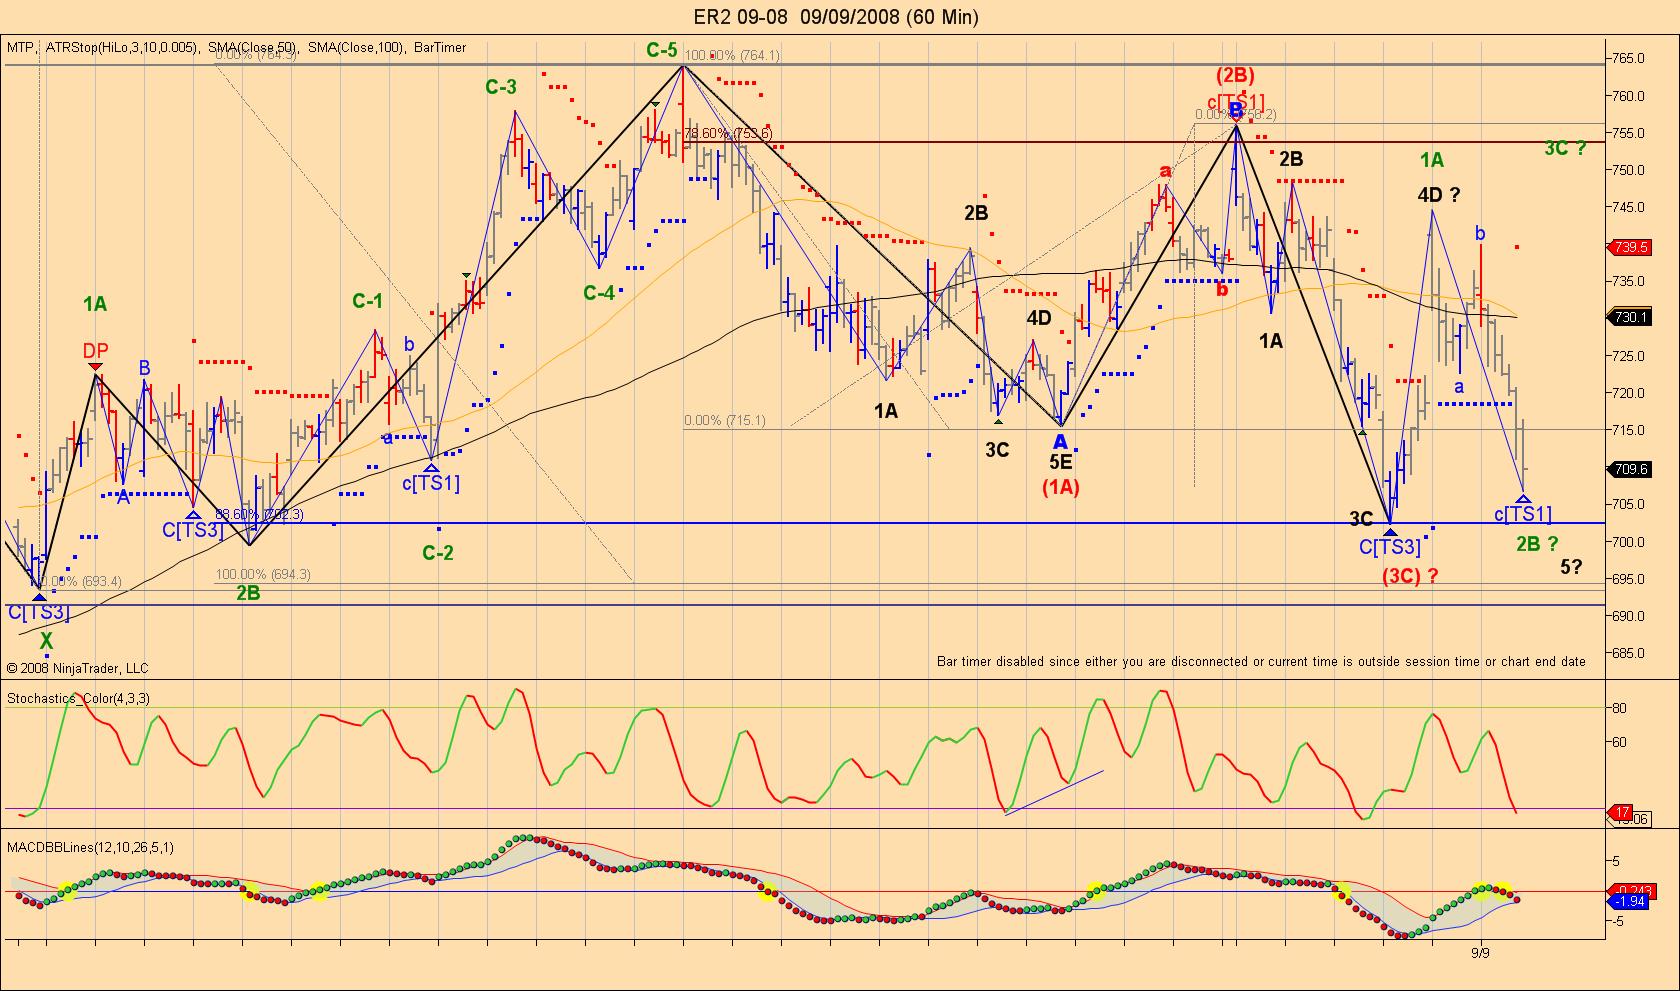
To help you have a better view of that last 15 min chart I will post the 60 min as this usually helps see the bigger picture and eliminates smaller waves.
Click image for original size
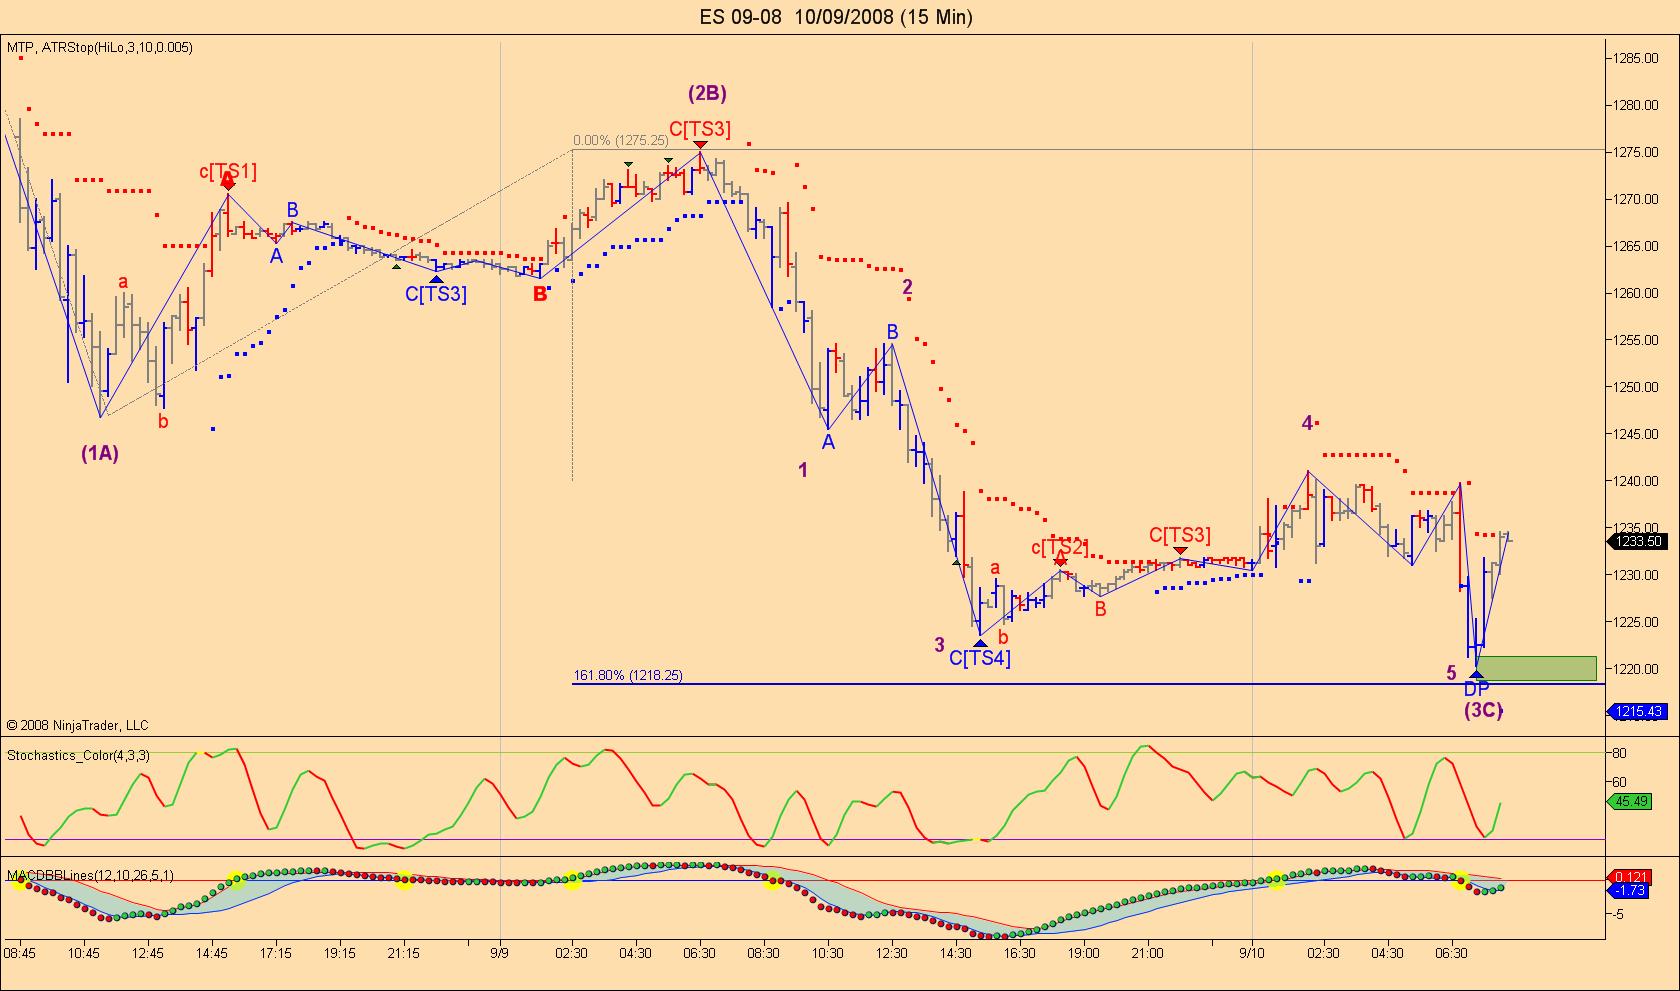
To make a follow up on Last night Market Review on the ES I will now post the 15 min charts updated but this time based on the 24 hour as we have now achieved what I was talking about.
We almost went to the 1.62% of wave (1A) and we have now a 5 waves pattern in the (3C) leg, so from this pattern we should expect some kind of a rally today. If this low is taken then it won't look too good for the bulls as the pressure will change to the downside.
We almost went to the 1.62% of wave (1A) and we have now a 5 waves pattern in the (3C) leg, so from this pattern we should expect some kind of a rally today. If this low is taken then it won't look too good for the bulls as the pressure will change to the downside.
Click image for original size
Larry, "we went up to 1.62% of wave 1A" -
what number is that on the S&P? It's difficult to understand which 1A you are talking about. Thank you.
what number is that on the S&P? It's difficult to understand which 1A you are talking about. Thank you.
quote:
Originally posted by stock_trader
Larry, "we went up to 1.62% of wave 1A" -
what number is that on the S&P? It's difficult to understand which 1A you are talking about. Thank you.
The 1.62% means that wave (3C) length is now 1.62% of the length of wave (1A) transposed from the top of wave (2B)this is a classic wave measurement using Fibonacci numbers.
To help clarify furthermore, wave (1A)top is 1282 his low is 1246.75 so for easier calculation we will round it up to 1247 so 1282- 1247= 35 that is the length of wave (1A) so we now take 35 and multiply it by 1.62 this equals 56.7 so we now take wave (2B) top and substract it with 56.7 this equals ( 1275- 56.7) 1218.
I hope this answers your question
Thanks for the reply map, I think people have more difficulties to understand the EW concept and that's ok. I wanted to share my views on EW but realize now that this is not for everyone as it is not easy to understand so reason why I will post less wave count but more pic's of trades that I will take instead.This will be done if I have time of course.
Laurent
Laurent
Emini Day Trading /
Daily Notes /
Forecast /
Economic Events /
Search /
Terms and Conditions /
Disclaimer /
Books /
Online Books /
Site Map /
Contact /
Privacy Policy /
Links /
About /
Day Trading Forum /
Investment Calculators /
Pivot Point Calculator /
Market Profile Generator /
Fibonacci Calculator /
Mailing List /
Advertise Here /
Articles /
Financial Terms /
Brokers /
Software /
Holidays /
Stock Split Calendar /
Mortgage Calculator /
Donate
Copyright © 2004-2023, MyPivots. All rights reserved.
Copyright © 2004-2023, MyPivots. All rights reserved.