Kool's Tools for Price
Price Projections
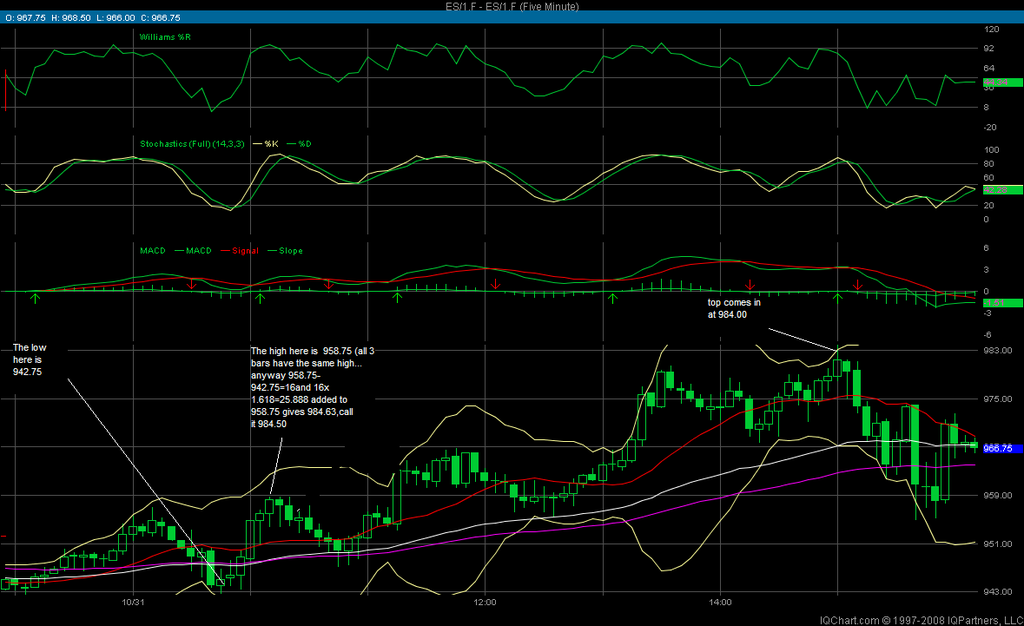
Alright, enough about the cycles (time) which seemed so simple but I guess not. This thread will address price projection a powerful tool but probably not as accurate as my cycles. First the theory, but its 'pseudo science' so skip it if you choose. My theory is that there is no 'randomness' in the markets but they have a definite mathematical structure. They are a product of investors' perceptions of events, value etc. I told you I used to study Elliot back in the day but could never consistently interpret the wave structure correctly. But it fascinated me that waves both up and down were often related by Fibonacci ratios. Wave 3's were often related to wave one's (the initial thrust up) by ,say 2.618 or something. Again going back to the waves within waves concept (wave1 if viewed closer has its own wave 1 through 5 and so on to infinity!) It struck me that virtually every tick is an up or down thrust culminating in a eventual top or bottom. Pretty weird , I know. That's kind of how price projection was born. I figured virtually every move both, up or down has an initial move which should be related to its own little wave3, or maybe even wave5 by a fib. ratio. Enough with the 'eclectic' guess at why this works. I use the golden ratio of 1.618 to forecast a price projection target. Warning: like my cycles, all this is telling you is where a 'bounce' may be, not whether it's for a point or twenty points. That's why I use it as a tool in conjunction with moving averages, my simple indicators and my simple (or so I thought) little cycle technique. Often times several different charts will give me the same number. (And not from the same points on the chart!) Such was the case recently with the 825.00 low on the ES. On a shorter term basis, same thing with the 984 top. Predicting a turning point is frankly, not that difficult, but knowing if that turn will be 5 ticks or 500 is. That's why I'm a scalper . All I really care about is the next few minutes. Any way remember I commented on the cycles thread that I knew by around 10:15 that the market 'wanted' 984? Here's how that came about. Remember, the theory is that every initial move times 1.618 and added to the end of that initial thrust gives the point at which it will run out of gas so to speak. What happens after I'll get into in the following chart.
Alright, enough about the cycles (time) which seemed so simple but I guess not. This thread will address price projection a powerful tool but probably not as accurate as my cycles. First the theory, but its 'pseudo science' so skip it if you choose. My theory is that there is no 'randomness' in the markets but they have a definite mathematical structure. They are a product of investors' perceptions of events, value etc. I told you I used to study Elliot back in the day but could never consistently interpret the wave structure correctly. But it fascinated me that waves both up and down were often related by Fibonacci ratios. Wave 3's were often related to wave one's (the initial thrust up) by ,say 2.618 or something. Again going back to the waves within waves concept (wave1 if viewed closer has its own wave 1 through 5 and so on to infinity!) It struck me that virtually every tick is an up or down thrust culminating in a eventual top or bottom. Pretty weird , I know. That's kind of how price projection was born. I figured virtually every move both, up or down has an initial move which should be related to its own little wave3, or maybe even wave5 by a fib. ratio. Enough with the 'eclectic' guess at why this works. I use the golden ratio of 1.618 to forecast a price projection target. Warning: like my cycles, all this is telling you is where a 'bounce' may be, not whether it's for a point or twenty points. That's why I use it as a tool in conjunction with moving averages, my simple indicators and my simple (or so I thought) little cycle technique. Often times several different charts will give me the same number. (And not from the same points on the chart!) Such was the case recently with the 825.00 low on the ES. On a shorter term basis, same thing with the 984 top. Predicting a turning point is frankly, not that difficult, but knowing if that turn will be 5 ticks or 500 is. That's why I'm a scalper . All I really care about is the next few minutes. Any way remember I commented on the cycles thread that I knew by around 10:15 that the market 'wanted' 984? Here's how that came about. Remember, the theory is that every initial move times 1.618 and added to the end of that initial thrust gives the point at which it will run out of gas so to speak. What happens after I'll get into in the following chart.
Friday's Action
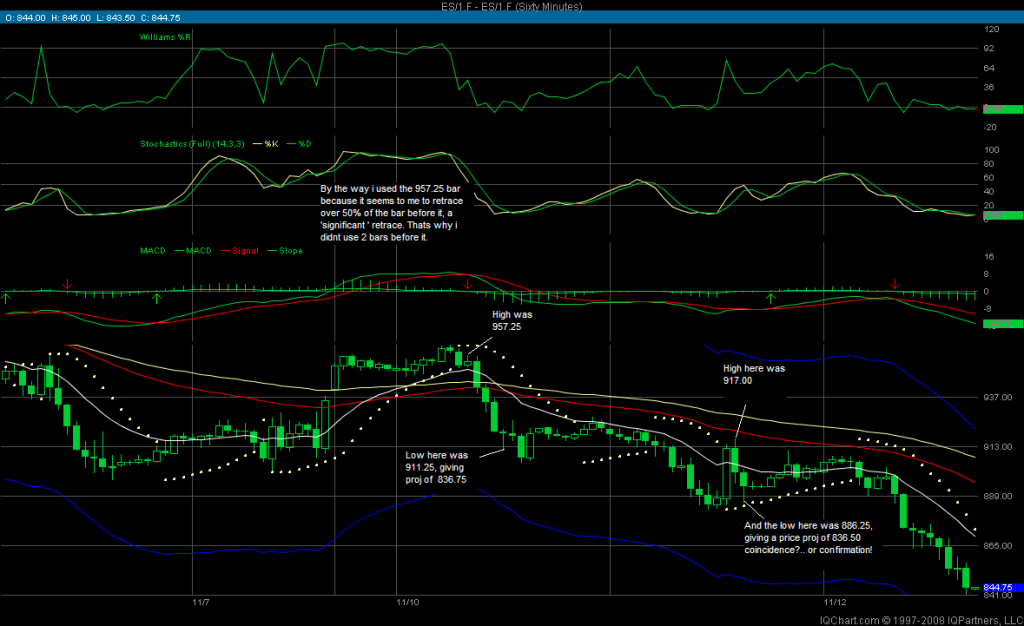
OK ,now here's Friday's action and how I actually use this tool. FIRST, THE CHART AND THEN AN EXPLANATION.
OK ,now here's Friday's action and how I actually use this tool. FIRST, THE CHART AND THEN AN EXPLANATION.
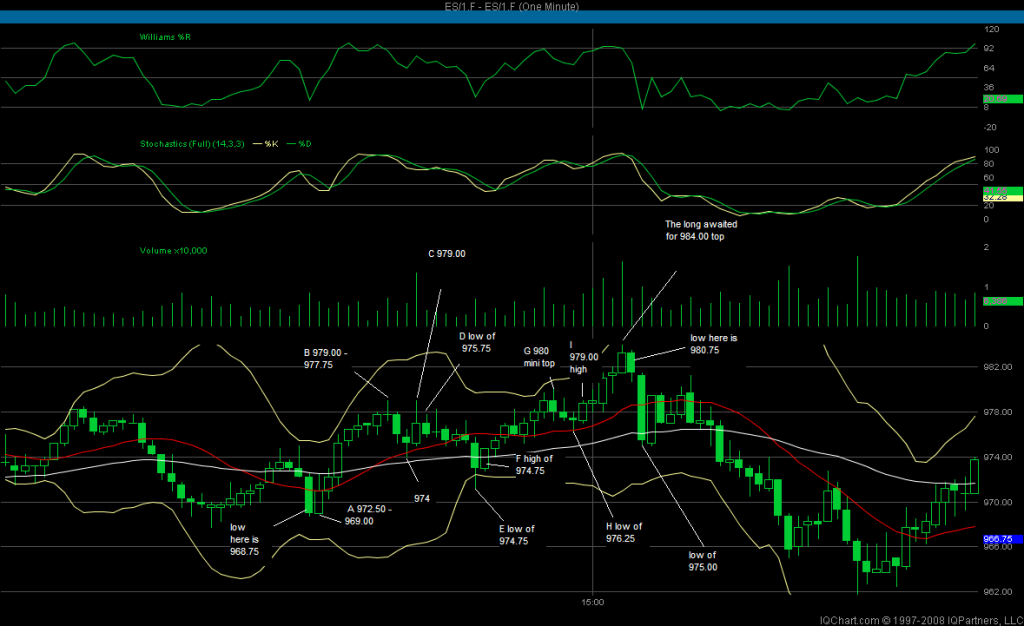
Ok, I don't really know if 984 will be achieved or not, just that the market wants it and if it gets it, it could be a decent turning point. As we get closer here's some minor examples of price projection on the way. I get a rough overview from the 5 or 15 min chart but the 1 minute is what I trade off of. First move up before much retracement from the 968.75 low is A where the high is 972.50 (972.50 - 968.75=3.75 and 3.75x1.618 is 6.06. Added to the end of the move at 972.50 gives 978.56. Projection hit at B 979 (I don't quibble about 2 or 3 ticks, since my stops are 2-4 handles usually!) B has a high of course of 979.00 and a low of 977.25 , which I missed typed on the above chart. Do the math. Projection is 974.42, off by only 2 ticks on a 5 point move! Pretty cool, huh? The market then retests the 979.00 high travelling to the initial low of 975.75 on the next bar before any move back up. This of course gives a projection of 970.50 and the low at E (which I once again mislabeled was 971.25). So sue me because I missed by 3 ticks! Still pretty dam close. Then we go from 971.25 to 974.75 (see why I mislabeled?) and this gives 980.40 which of course is hit at G off by less than 2 ticks. Is all this coincidence, maybe but all I know is these 'coincidences' happen every single day, and I take advantage of it every single day! Well now were getting close to 984 and your friends aren't laughing at you anymore like they did in the morning. (Remember the cycles from the cycles article? You even know within a few minutes when the next peak might be!) Finally the 976.25 low goes to 979 before the next bar retraces almost half of it. Projection is now 983.44 (call it 983.50 and this morning the bigger 5 min chart was saying 984.50 so there's your range and trade if the technical indicators agree! ( AND YOU EVEN KNOW WHEN!)
Well you knew the market had a high likelihood of a bounce off of the 984 area and since it had been going up most of the day getting extremely overbought even on the 15, 30 and 60 min charts you're pretty sure it's going to be a good trade. Now what? Depends on your time horizon , but I'm a scalper and I just wanting a few handles the very next 1 min bar telegraphed a decent move possible to 975.50 or so as you can see! and since I usually jump out at the first 'stall' , I probably would have bailed around 976-977. There you have it. Not as hard as you think. I have most of the math memorized and only rarely use my little calculator. For instance, a 3 point move ,add or subtract, 4.75 to 5 and so on.
Well you knew the market had a high likelihood of a bounce off of the 984 area and since it had been going up most of the day getting extremely overbought even on the 15, 30 and 60 min charts you're pretty sure it's going to be a good trade. Now what? Depends on your time horizon , but I'm a scalper and I just wanting a few handles the very next 1 min bar telegraphed a decent move possible to 975.50 or so as you can see! and since I usually jump out at the first 'stall' , I probably would have bailed around 976-977. There you have it. Not as hard as you think. I have most of the math memorized and only rarely use my little calculator. For instance, a 3 point move ,add or subtract, 4.75 to 5 and so on.
Elaboration
I don't have Metatrader, Ninja, or any of the fancy tools. I used to trade for a living , but now just for fun. I intentionally keep my life very simple. Just using the charts, and a simple calculator I've had 2 losing days in the last 2 months and they had nothing to do with the cycles, or price projection. On one day I held over the weekend (which I almost never do) and the market opened 20 handles against me! The other day, I 'chased' all day. I still battle the same demons all traders face! My work is really quite simple! Once you get the hang of it. At a glance you can usually get a good idea of what's going to happen next.
For a real life (textbook trade using this method) example, go to the forum and checkout the trader's lounge under the globex 11-03-08 thread starting about 7:38 . Follow along with your charts. I take great pains to explain my projection and make yet another 'brilliant' call. NOT REALLY YOU CAN TOO!
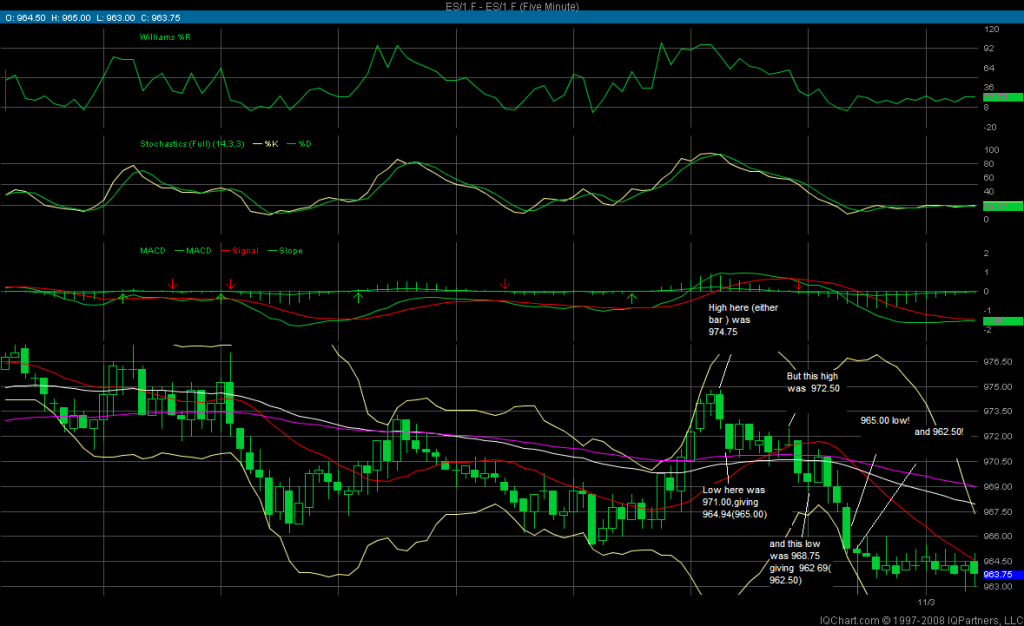
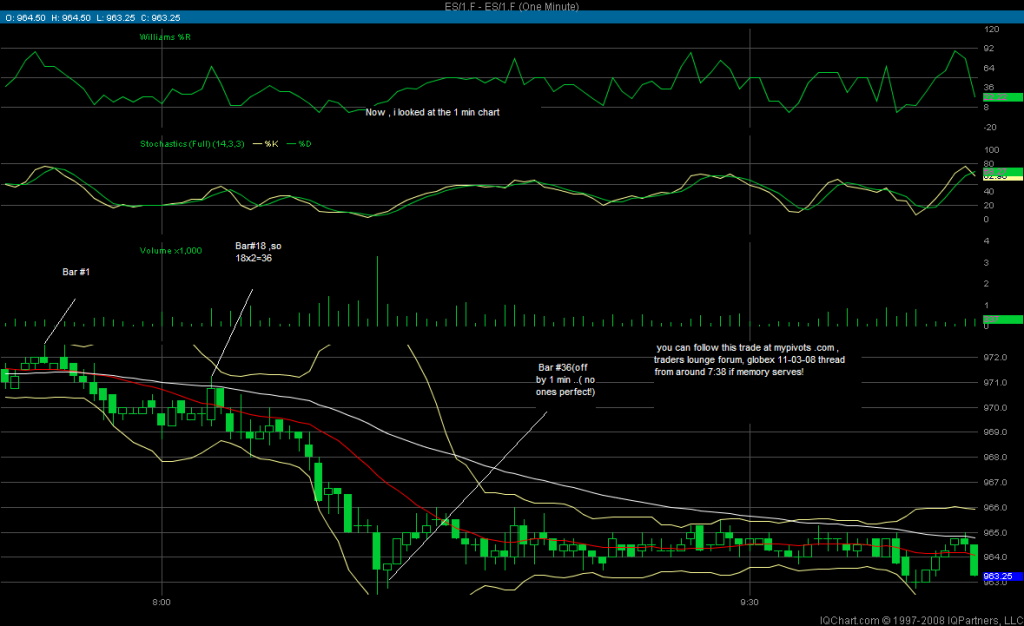
Remember the top chart is 5 min. At 7:36 on 11/3/08 I state on the forum that I just looked at the chart and saw the projection to 964! I'm trying to show on the above chart how I figured that out. That's why I got short a few min later (7:38) or so at 972.00. Later on of course as you can see on the top chart (5 min) an even lower projection may have been given (962.50). Anyway, as we get closer to the 964 objective I switch to the shorter term 1 min chart (the lower chart above) and basically look for cycles for when might be a low. That gives me an idea of when! My intention was to show others what I see on the 2 above posted charts during a sample trade cause just following the posts on the forum may not always be that clear! Hope that helps!
I have the standard 14 bar %r , the only difference is my overbought line is 92, not 80 and my over sold is 8 not 20 . Same for all time frames (1, 5 , 15, 30, and 60, minute charts ) I also have a 54 period exponential average on all charts. Mostly I just look at 5 min and 1 min, cause I'm a very short term scalper . Some times on big moves I look to the longer time frames for moving averages (54 and Bollinger) for possible support or resistance. Also to see if a top or low might be ' important' i.e. all time frames oversold or overbought. Obviously those tend to be bigger moves!
I have the standard 14 bar %r , the only difference is my overbought line is 92, not 80 and my over sold is 8 not 20 . Same for all time frames (1, 5 , 15, 30, and 60, minute charts ) I also have a 54 period exponential average on all charts. Mostly I just look at 5 min and 1 min, cause I'm a very short term scalper . Some times on big moves I look to the longer time frames for moving averages (54 and Bollinger) for possible support or resistance. Also to see if a top or low might be ' important' i.e. all time frames oversold or overbought. Obviously those tend to be bigger moves!
An example
I just nailed a good trade like that in the traders lounge, ES 11-04-08 thread, last page or 2. All time frames were extremely oversold , I had projections to a max of 986.50 and a buy in at 987.50 expecting a run to at least 999.25.
When the indicator is way up high on my chart , it's above 92 and would be overbought (or think of it as bought too much) and ready to be sold! The reverse when the indicator is low and below 8. Then it's 'sold too much' (called oversold) and ready to be bought
Koolblue - Thank you for posting your price projections. I have tried to follow your explanation but I'm confused about which price and factor to use. I see that you take a low and a high and multiply times 1.618 or 2.618. Can you please clarify the price time frame and when the 1.618 or 2.618 should be used? Thanks!
Emini Day Trading /
Daily Notes /
Forecast /
Economic Events /
Search /
Terms and Conditions /
Disclaimer /
Books /
Online Books /
Site Map /
Contact /
Privacy Policy /
Links /
About /
Day Trading Forum /
Investment Calculators /
Pivot Point Calculator /
Market Profile Generator /
Fibonacci Calculator /
Mailing List /
Advertise Here /
Articles /
Financial Terms /
Brokers /
Software /
Holidays /
Stock Split Calendar /
Mortgage Calculator /
Donate
Copyright © 2004-2023, MyPivots. All rights reserved.
Copyright © 2004-2023, MyPivots. All rights reserved.