ES Short Term Trading 4-21-10
Here's my Monkey S/R price levels from what I see. The Red lines are the "regular" potentially significant ones while the Magenta ones are somewhat significant, but a step down from the Red ones. Here's the 30min chart of 'em ... a map for Wednesday.
Click image for original size
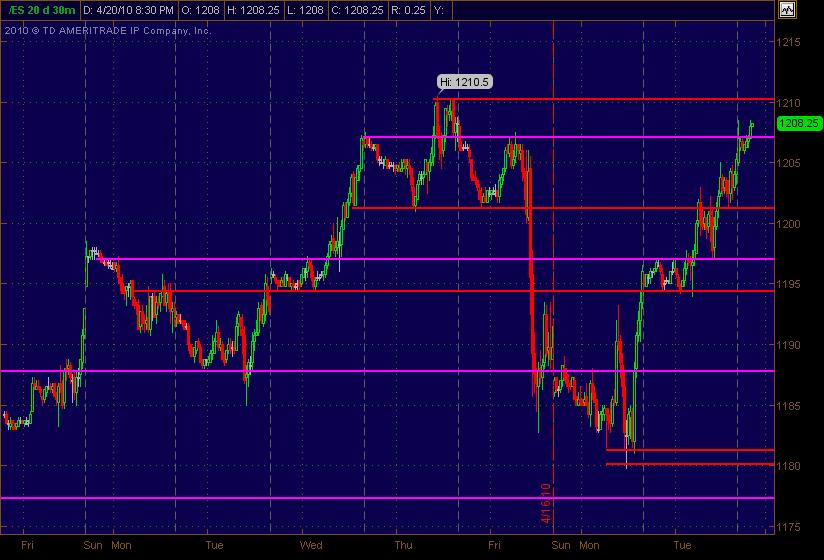
Weekly R1 is 1206.25 (could become support considering where/how the ES is currently trading as I'm posting this). Daily R1 is 1209.50 near last Thursday's RTH High of 1210.50.
Don't have anything I'm comfortable posting as Resistance above the current market ... and it's currently near 9pm Central Time with ES trading @ 1209 (up into Daily R1 and near Thursday's RTH High).
The overnight action might offer some good xtra mapping coming into Wednesday's trading. I'd defer to Bruce and others who have been tracking how price action unfolds when challenging RTH and Overnight Highs/Lows and the 50% RTC that's been prominent lately ... and also the Market Profile inputs.
Didn't go thru any stocks tonight (so no insight there) ... but went thru a few Buds, 3 Bass Ales and about to encounter a rum and coke. I think I should chart the calories and run with at least 3 oscillators on that ... maybe a few trendlines and a fib or two.
Click image for original size
GLOBEX session is reacting favorably to AAPL earnings beat. Today was almost a trend day, esp. if you looked at it after the 1st hr of the session.
Key levels that I will be watching for a trade:
1211: Thurs hi overshoot
1208.5: gap fill resistance
1206.5: composite Hi volume node + last Wed. close
1201.25: composite Hi volume node + morning range hi
1198: Mon. morning range low reaction
1196: composite low volume node + gap fill support
1193: major resistance area from previous week and Friday + 38% Fib RT
Click image for original size
here is the carryover chart from my post in yesterdays thread. They will attempt to fill in this area on the chart with the 1202 being the key price.....It would have been a good trade but I missed the short....anyway this is the area they will fill in and the volume histogram to the right of my chart should become bell shaped
Click image for original size

Phileo,
Years ago Dell was the market buzzword stock. I remember one particular day when they missed earnings the ES was down about 30 points in the overnight. The next day the buyers came out in force and closed that gap in the ES. It was amazing and I was glad to take part in a small fraction of that move.
Although I don't do it personally, I think it's a great idea to watch key market moving stocks. Probably more important is to see how all the markets are responding and if the news is helping the other indexes. Last night was a cool example of the YM just barely getting out of yesterdays RTH highs after that news. Thanks for keeping us updated with that.
Those were the good ol' days with Dell and a few other stocks - especially Nazzies. We'd back the truck up and LOAD up long on the open. Had some of my bigger days on those plays and with that underlying scenario at work.
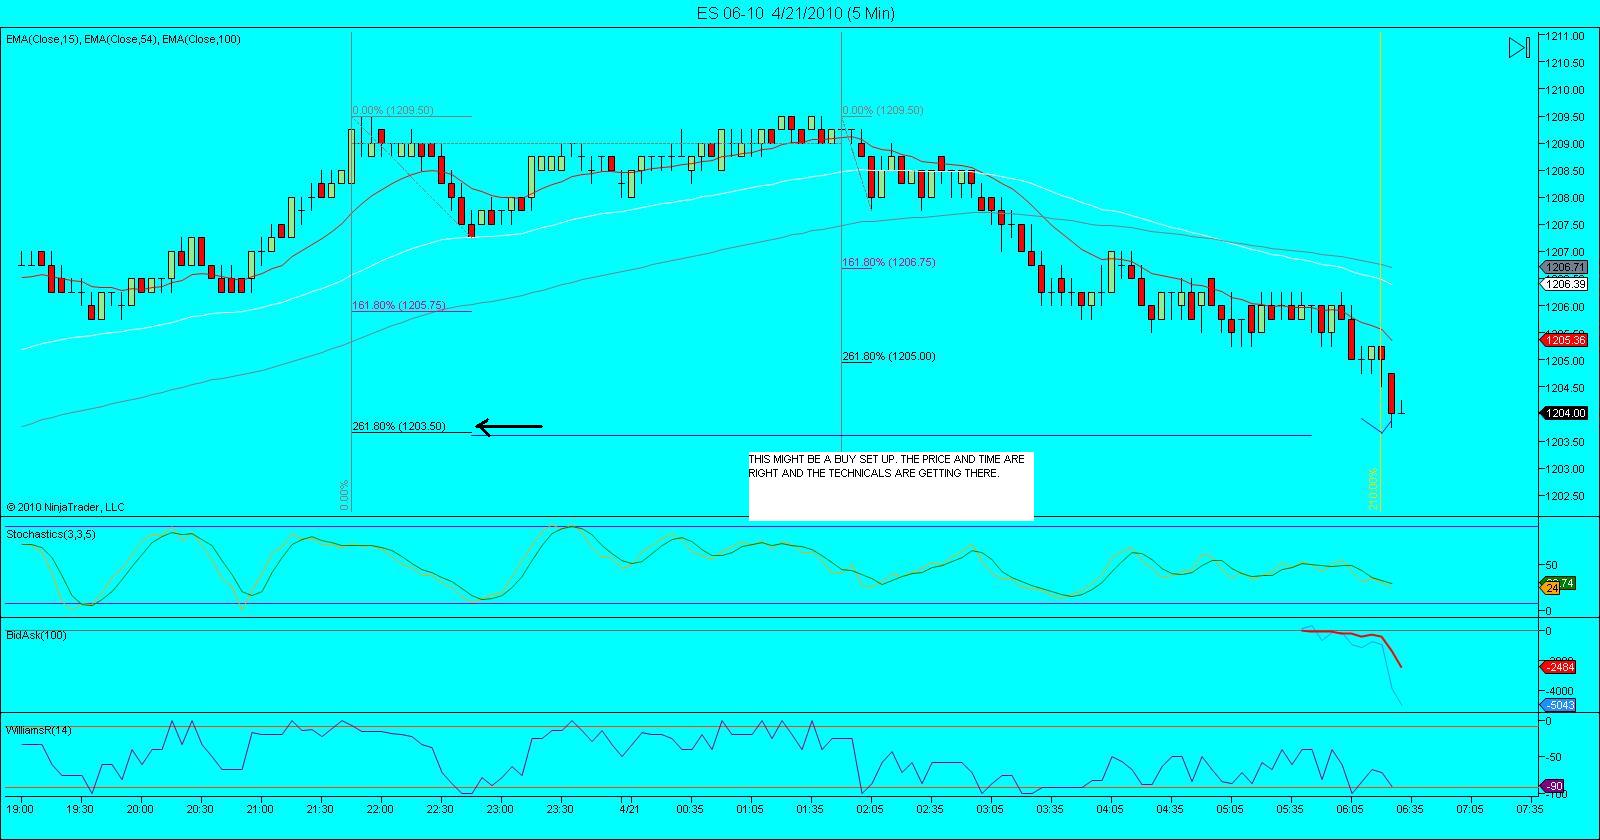
pre mkt. bounced off a support line I had and I got long @ 1202.50 w/stop at BE+1-point now ... had been waiting for that trade ... wasn't around for any shorts up near 1210, but wouldn't have taken them anyway because was uncomfortable with potentially getting run out.
Was good to see some others here posting numbers right in that same area ... nice for confirmation, espec. when coming from different angles of analysis.
As we are near the open so I think we are going to see a choppy open. So the oscilators are going to make money. Also SP yesterday open at 1186 needs to be tested. The only thing preventing it is the 1203 area which is a swing low
I'm hoping for a pop up in RTH above1205 -1206 to sell into and target that 1202 number...concern is that "bad" high ( multiple prints) at that ONH.....not much to move the market today....also a bad low at yesterdays RTH low so that will be tested soon....lots of numbers at the 95 - 97 as already mentioned
They have made their attempt to go up now lets find an entry
Key number for today as S/R is 1205.75, it was yesterday's high.
Originally posted by ak1
As we are near the open so I think we are going to see a choppy open. So the oscilators are going to make money. Also SP yesterday open at 1186 needs to be tested. The only thing preventing it is the 1203 area which is a swing low
Originally posted by ak1
Oh!I meant in terms of touching open, highs and lows. If Dow touches one and SP doesn't then we have a divergence that is met the following day. Just a trading bias for the next day.
Sorry folks yesterday's (20/04) open was 1195.75 not 1186. This level was finally touched.So if we notice any diversion between SP and Dow and use it to enter we may profit.
Emini Day Trading /
Daily Notes /
Forecast /
Economic Events /
Search /
Terms and Conditions /
Disclaimer /
Books /
Online Books /
Site Map /
Contact /
Privacy Policy /
Links /
About /
Day Trading Forum /
Investment Calculators /
Pivot Point Calculator /
Market Profile Generator /
Fibonacci Calculator /
Mailing List /
Advertise Here /
Articles /
Financial Terms /
Brokers /
Software /
Holidays /
Stock Split Calendar /
Mortgage Calculator /
Donate
Copyright © 2004-2023, MyPivots. All rights reserved.
Copyright © 2004-2023, MyPivots. All rights reserved.