ES Short Term Trading 5-18-10
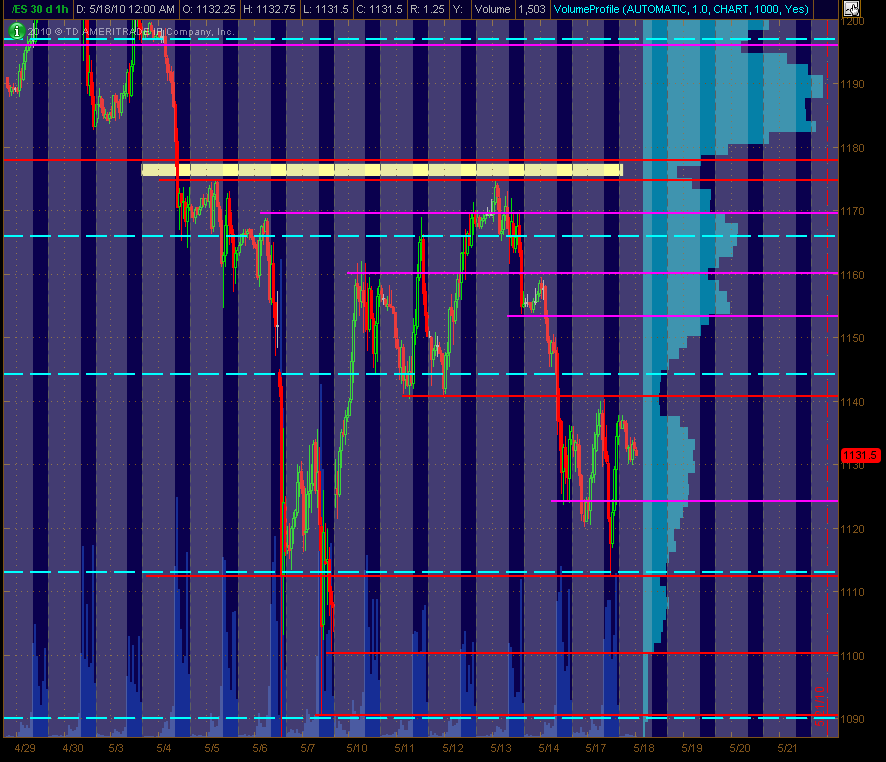
Here's my 30m ES chart with S/R levels based on price action ... Red are potential significant levels with Magenta as semi-significant ones. The Cyan dashed lines are the Weekly Pivots. This is a map for trading coming into Tuesday for me. There's also a Volume Provile of the past 30 trading days shown on the right side of the chart. Hope it's helpful to all.
Click image for original size
so those who are quick will try to buy below 24.50 in hopes that it gets back into longer term value....we'll see from here
a dangerous place to be IMHO because we have that 18 - 20 volume from YD trade....seems too close not to push it there...if I didn't see that I'd want to get long in an attempt to get back to the middle and the 28 - 31 area
I have days developing VA with a low at 24 area too..

I bet ya can tell I'm not actually trading right now...having too much fun with these...anyway here is Friday and Monday combined and today as it has unfolded so far.....I snapped the lines at the peak volume from Mon& Tuesday..that is the real line to beat.....also of interest is that ledge down at 17.25 ...so far we had two attempts to get abpve that key zone..failure now cleans up that ledge and the 20 area I mentioned
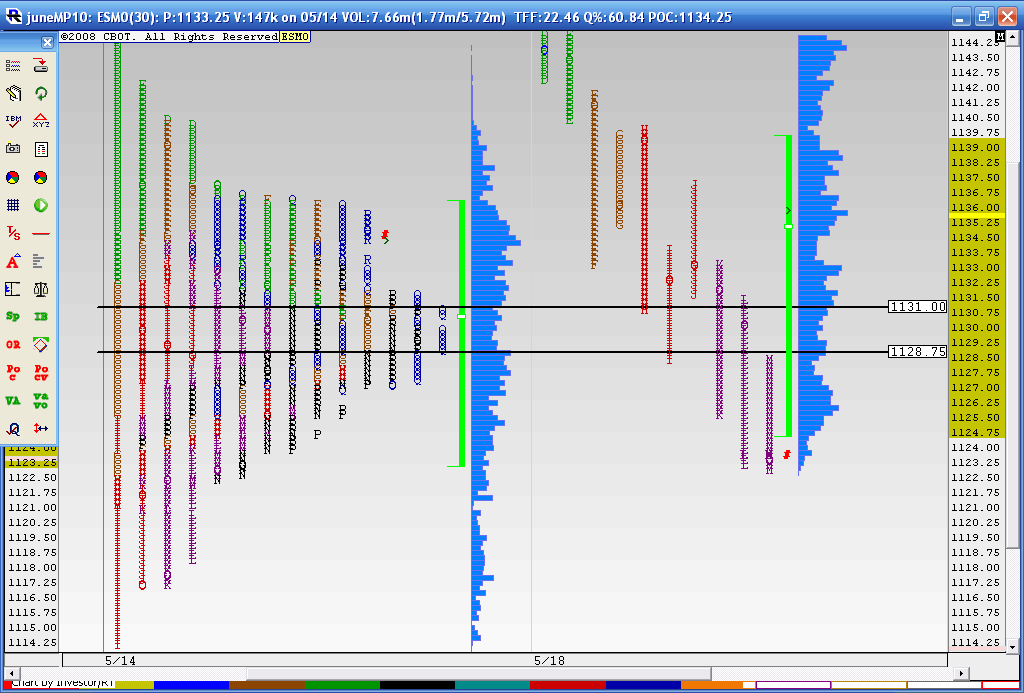
here is the chart I forgot from last post
Click image for original size
I am signing off now. ( day was a joke for me, long at the open, escaped with a 1 tick profit, watched with mouth agape, the downside was not expected by me... when the market does something I do not expect, I sit on the sidelines... (I had expected gap up and go go go to hit mid 50s for close to gap fill).
For the rest of today: S1 needs to be tested? (S1 is 1118 handle)
longer term (tomorrow, or O/N), 1107.50 is gap fill.
with the way this market looks today (and with S1 at 1118 handle), another test of 1131 looks doomed to be rejected BUT,
BUT, pay attention to the 3:20-3:25 EDT window of time, if there is going to be a daytrader "closeout of winning shorts," that is probably the prime window for rebound (especially if 1118 prints). Nothing special about 3:20pm, except that I have seen it be a time turning point.
PA rules, all comments subject to change. LOL
Yesterday's Low is line of death for 1107.50 print... yesterday's low was 1112.75, drop below that by more than 3 pts, 1107 (for me) has to print.
good trading to all (better trading than I had today!).
normally I like to say a "trade begins with a target first then find a way to get that target"....
but today and today only I'm saying " A trade starts with actually pulling the trigger instead of jerking around with your charts"
That was a great trade that I missed.. oh well..I hope someone enjoyed the charts////LOL!!!.
but today and today only I'm saying " A trade starts with actually pulling the trigger instead of jerking around with your charts"
That was a great trade that I missed.. oh well..I hope someone enjoyed the charts////LOL!!!.
oh god,
1118 printed, I wasn't even looking at the chart while I wrote previous comment. and I don't want anyone to think that I was posting ex post facto.
sorry. I have intense focus and when I'm writing, I'm concentrating.
my focus is one of the reasons I don't post trades, unfortunately there are only a handful of trades I make where I do not glare/stare at every tick on the chart.
17.25 to the tick...man that's cruel....
I got killed today. I was to scared to pull the trigger when I should made up for it pulling it when I shouldn't. Same old mistake
Emini Day Trading /
Daily Notes /
Forecast /
Economic Events /
Search /
Terms and Conditions /
Disclaimer /
Books /
Online Books /
Site Map /
Contact /
Privacy Policy /
Links /
About /
Day Trading Forum /
Investment Calculators /
Pivot Point Calculator /
Market Profile Generator /
Fibonacci Calculator /
Mailing List /
Advertise Here /
Articles /
Financial Terms /
Brokers /
Software /
Holidays /
Stock Split Calendar /
Mortgage Calculator /
Donate
Copyright © 2004-2023, MyPivots. All rights reserved.
Copyright © 2004-2023, MyPivots. All rights reserved.