ES Short Term Trading 7/14/10
Mornin,
If there's another thread please let me know.
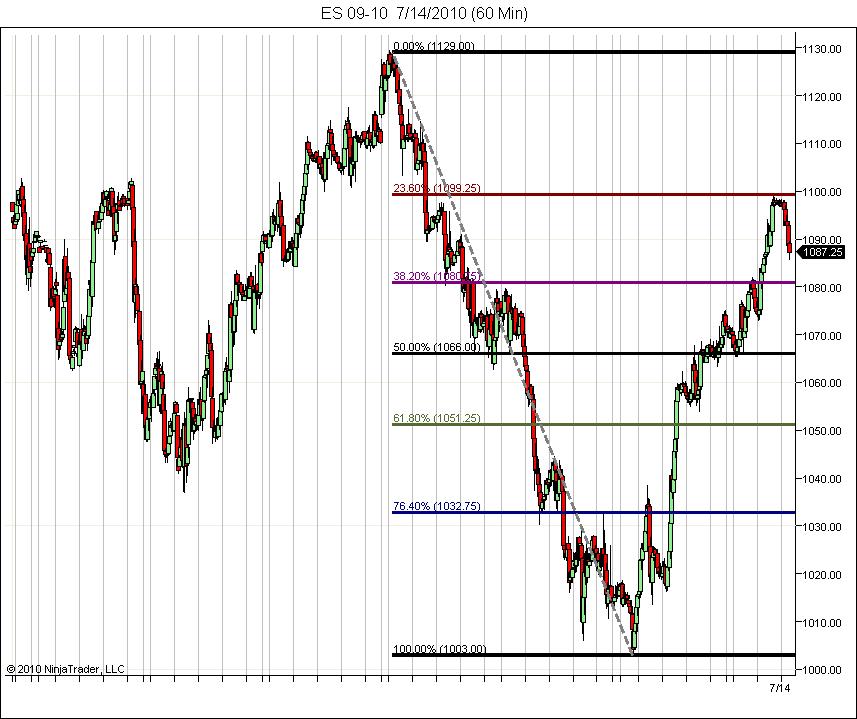
Here's a chart for you Bruce from your ah inquiry. Will post info for it later.
If there's another thread please let me know.
Here's a chart for you Bruce from your ah inquiry. Will post info for it later.
Click image for original size
here comes 1089!..one min chart has it at 1088.75
well ,covered one at b.e. and stopped onthe other at 1088.50..net loss of 3 handles..sigh..cant believe i didnt get my 1093.25 fill, but thats the way it goes sometimes...
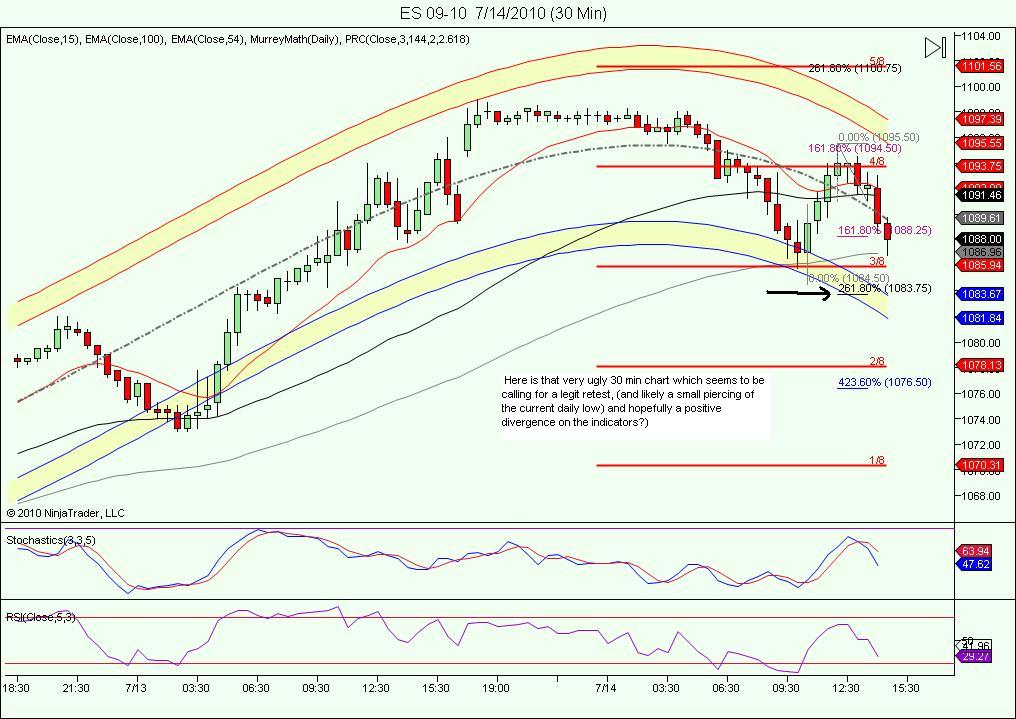
trying one last long at 1086.00.. looking for 'range air ' to get filled at 1091.00... (have to remind tho, that 30 min chart is Ugly for bulls!)
1087.00 is the volatility Pivot calculated using Dr. Brett's formula.
I think new lows and even 81 are coming as long as 90.5- 91.50 doesn't get a 30 minute close above there
Click image for original size
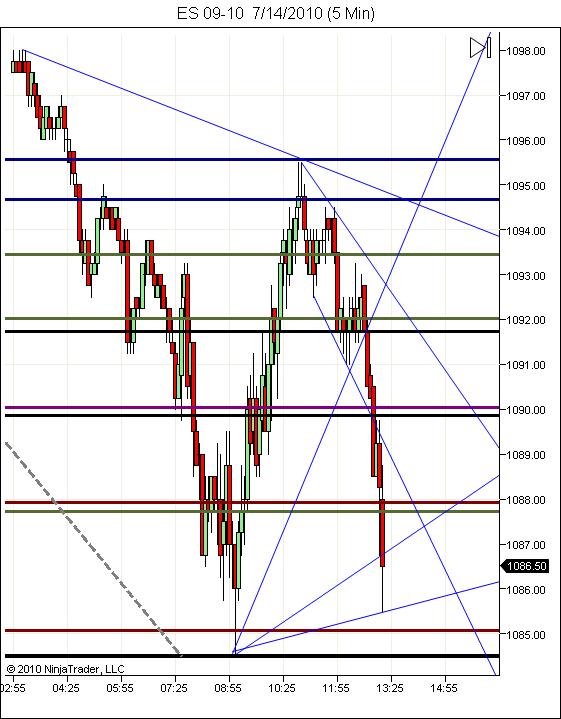
trendlines and candles help
Click image for original size
Originally posted by BruceM..could be friend , thats where the 30 min prc band is currently
I think new lows and even 81 are coming as long as 90.5- 91.50 doesn't get a 30 minute close above there
covering my 2 longs here... just too skittish to wait for 1088-89..
Monday and Tuesday Range is much like the hour range...good odds of them running out a side and so far it seems like it will be the Mon- Tuesday lowso I expect 84 minimum and further into the gap.......LOngs Beware...the first two days were the option folks messing with us I think....of course trade and close above the 91.50 will have me tricked but I think we have the longs trapped now by volume above!!
in that case Rburns it was the one minute volume spikes !!!If I had my I r/t up at that time it would have helped refine it a bit...but look at all one minute volume spikes begining with the open spike..!all the major ones came in the same zone today....so 87 - 89 is still critical!
Emini Day Trading /
Daily Notes /
Forecast /
Economic Events /
Search /
Terms and Conditions /
Disclaimer /
Books /
Online Books /
Site Map /
Contact /
Privacy Policy /
Links /
About /
Day Trading Forum /
Investment Calculators /
Pivot Point Calculator /
Market Profile Generator /
Fibonacci Calculator /
Mailing List /
Advertise Here /
Articles /
Financial Terms /
Brokers /
Software /
Holidays /
Stock Split Calendar /
Mortgage Calculator /
Donate
Copyright © 2004-2023, MyPivots. All rights reserved.
Copyright © 2004-2023, MyPivots. All rights reserved.