Multiple fib resistance levels
Three different waves. Two smaller waves obviously inside the larger.
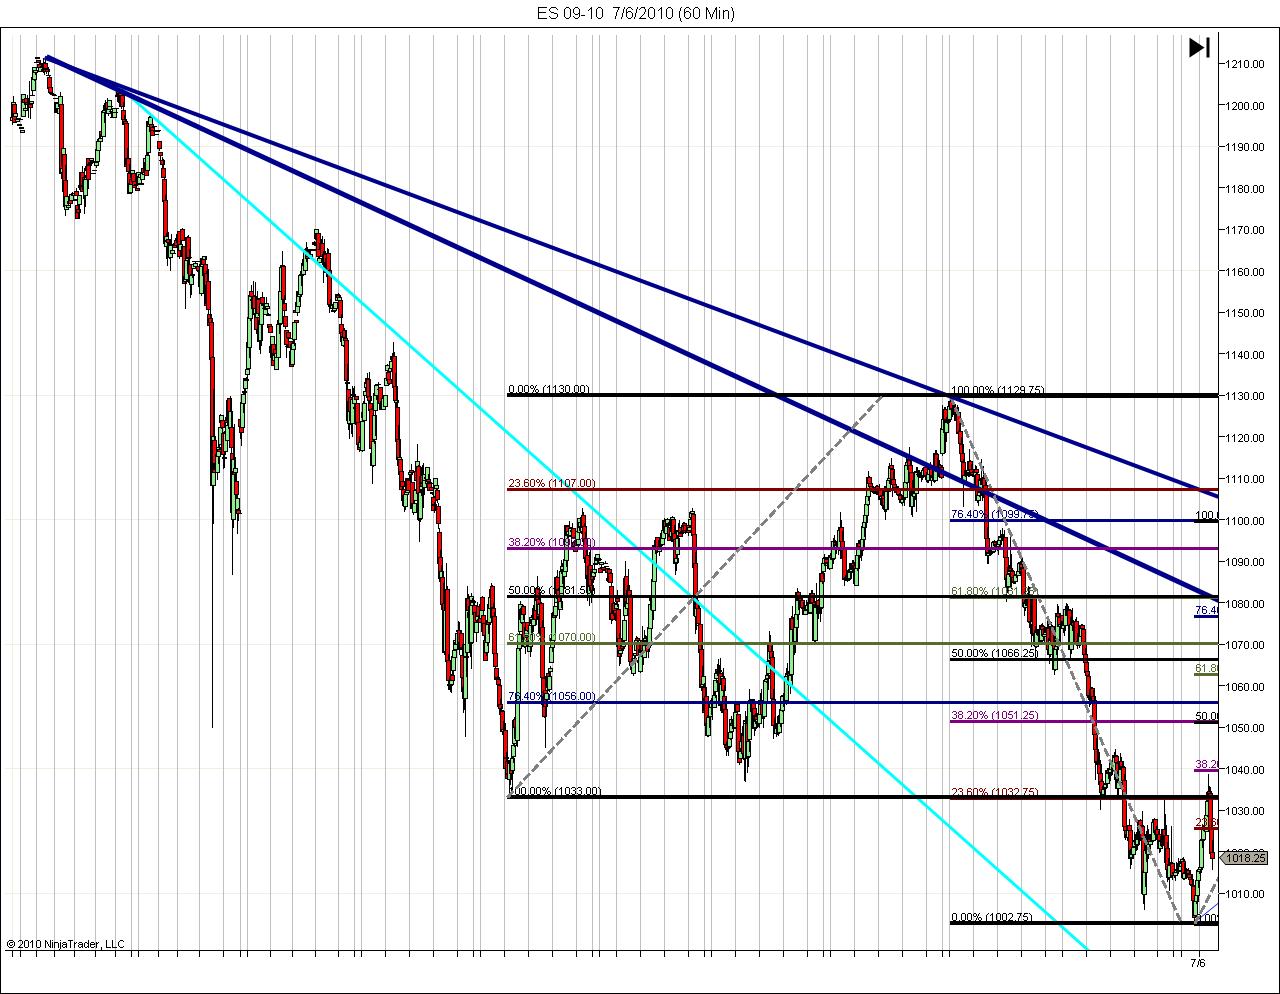
Same fib retracements applied to all three and spread out for your viewing pleasure. Note where multiple fib levels match up at, or nearly at, differing fib levels from larger or smaller waves. They are the thicker or congested lines.
Same fib retracements applied to all three and spread out for your viewing pleasure. Note where multiple fib levels match up at, or nearly at, differing fib levels from larger or smaller waves. They are the thicker or congested lines.
Click image for original size
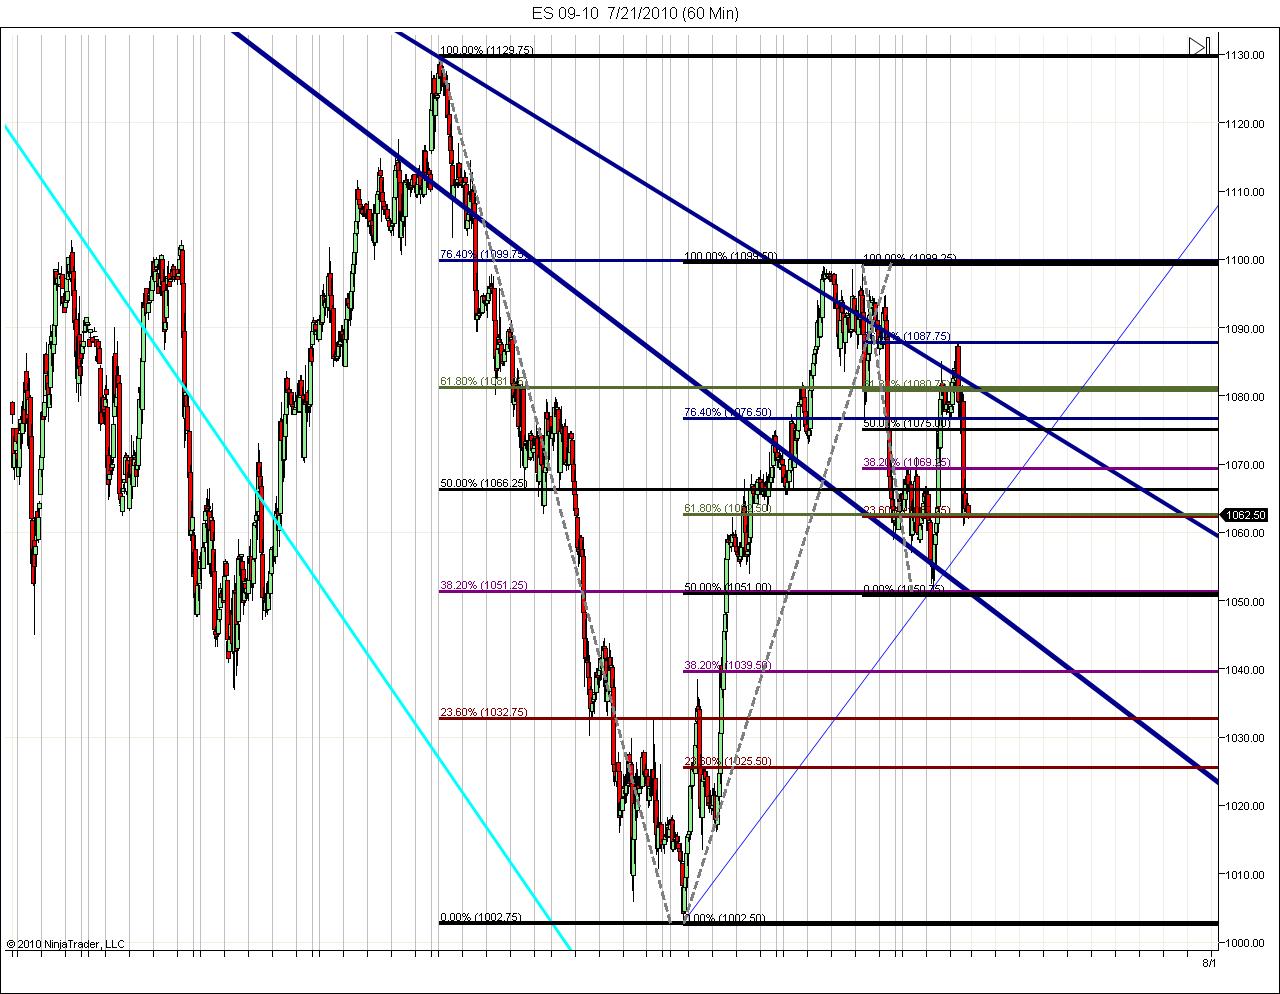
Confluence areas in terms of fib retracement levels. Do you use these levels as confirmation of a trend or reversal levels?
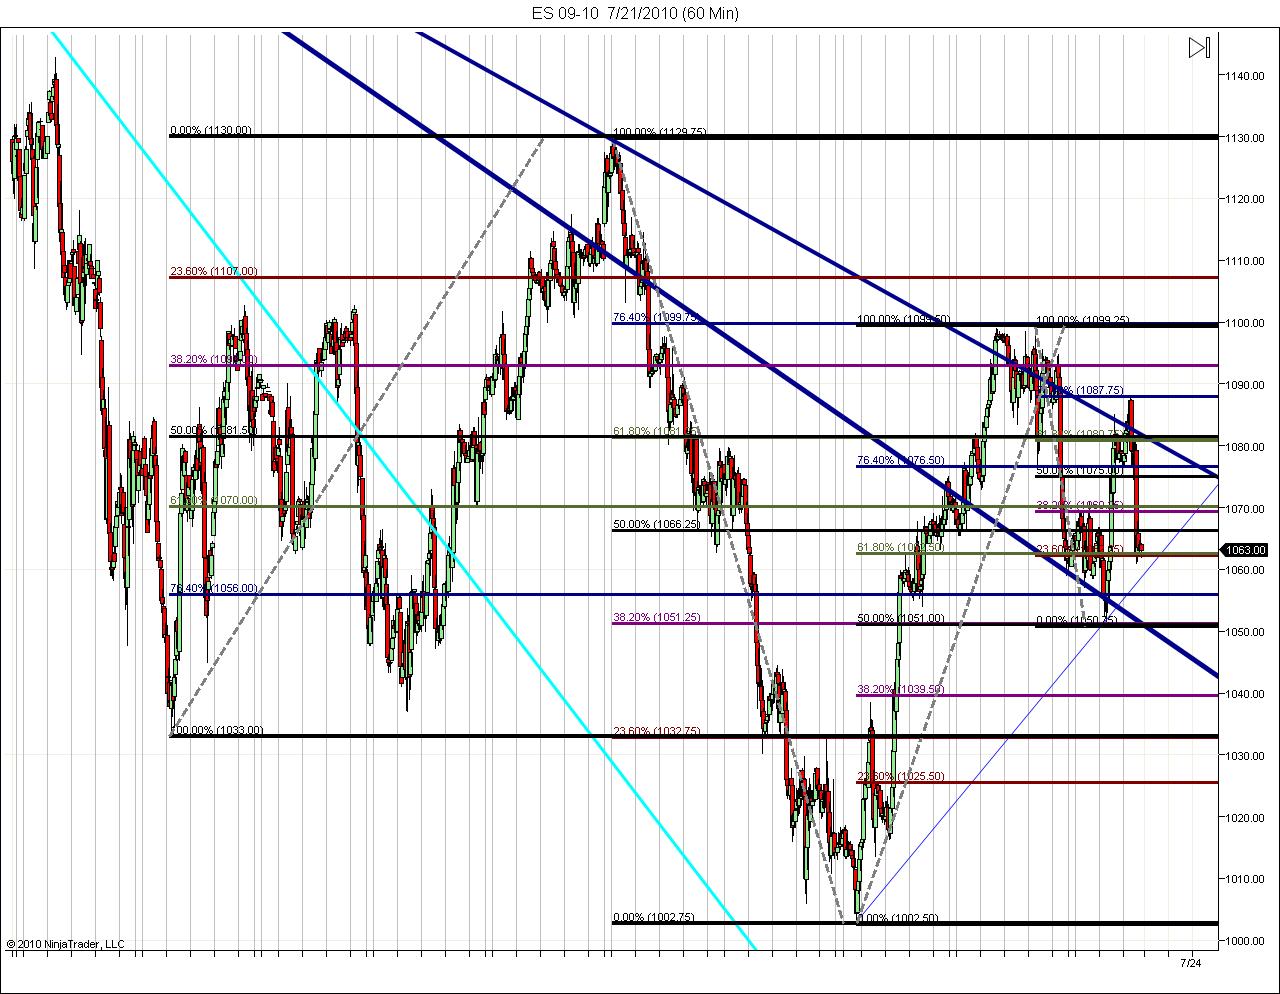
Let's go back one more wave and repeat applying a fib retracement. There are now three common fib levels about the 1081 level from four different waves.
Looking from left to right there seems to be more significance to the level the closer you get to the right edge.
Is this better than drawing a random horizontal line on your chart for a trading pivot? I believe it is. Not to discourage those would use such a method (as it could be superior to many others I've seen).
Can you use this in trading? I'm sure there would be doubters. Always are. However, I would draw your attention to the 1063 multiple fib level of todays (7/21/10) close. I'd also point out the considerable areas of congestion on the far right between multiple fib levels at; (1) 1099-1081 and (2) 1070-1050(with 1063 inbetween).
Click image for original size
And now for todays' chart(7/21/10). In AM noted the confluent fib levels(2 on my chart at that time).Futures had pulled back down below this level. Life seemed bullish in the forum. I didn't see it. I stated above them good, below bad. I posted them on an ugly chart.
Click image for original size
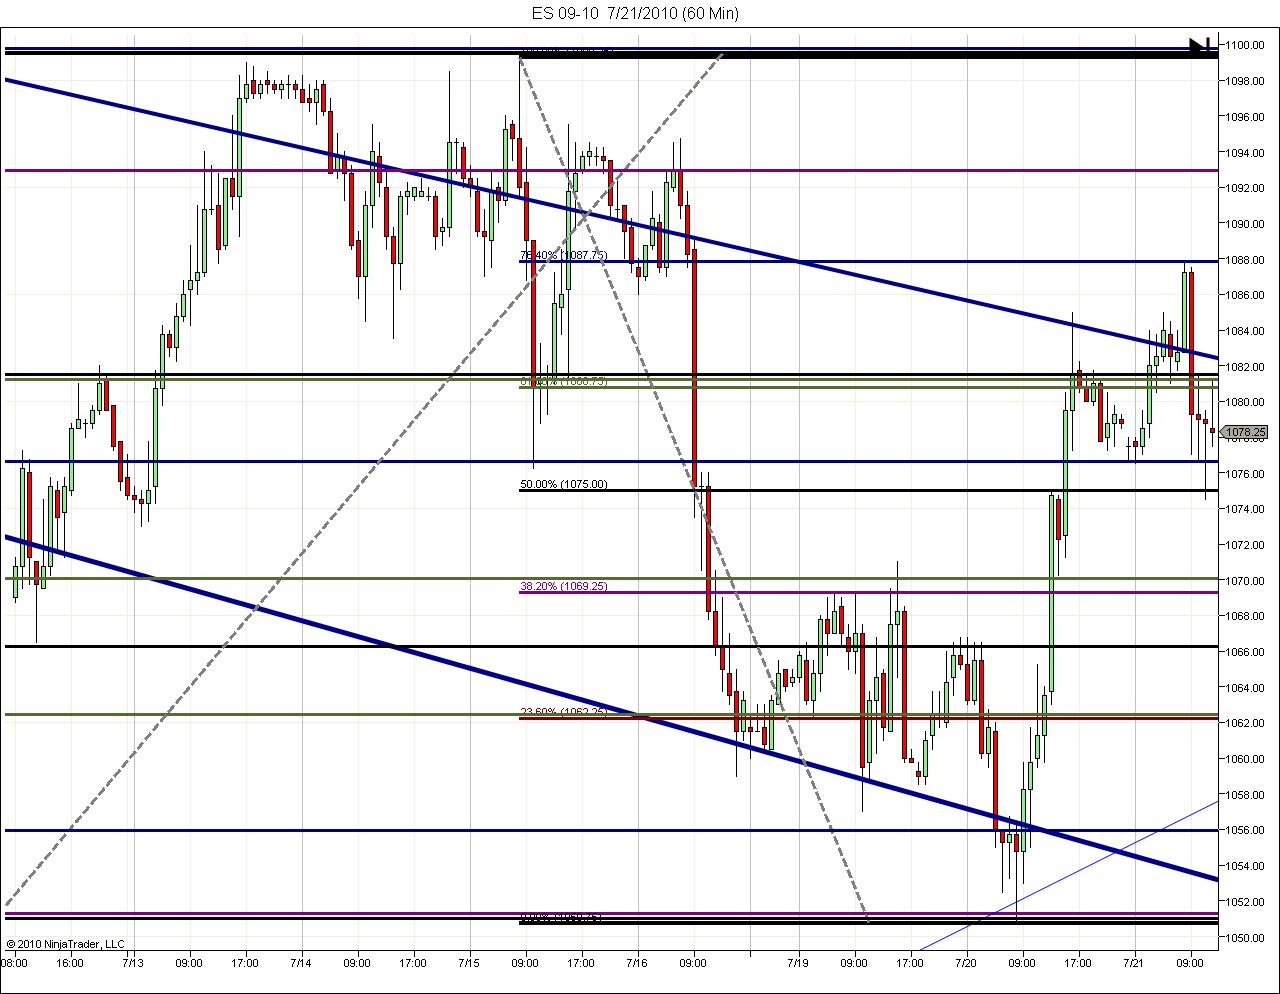
I'm not saying it has predictive qualities. It's only a horizontal S/R line to me. I would say I'd rather know where they are than not. I hope this may benefit your methods of trading.
Click image for original size
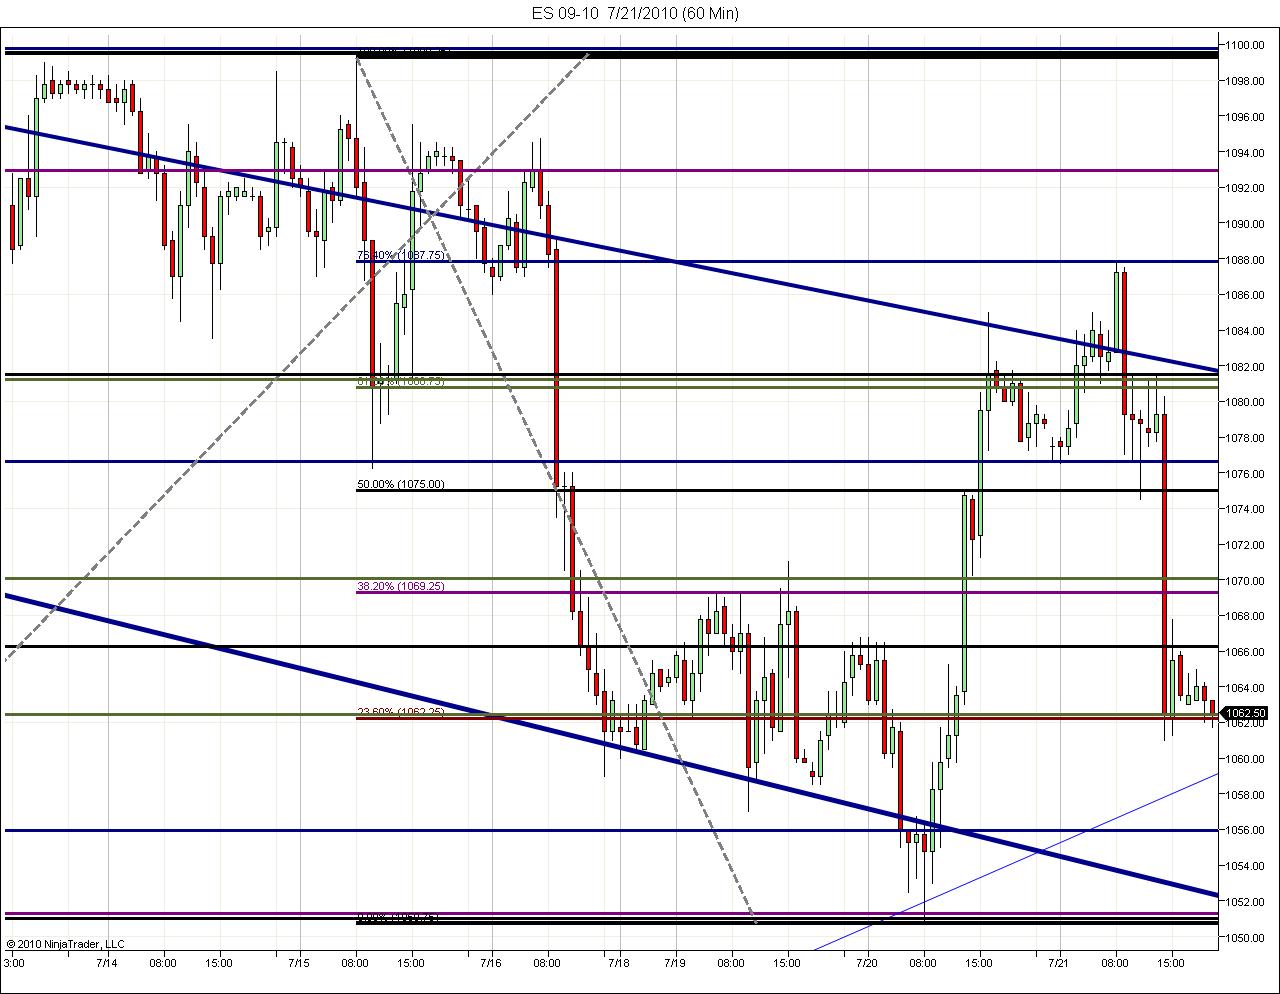
The dark blue downtrend lines are from the yearly high as of this date.
Click image for original size
I hope I answered the question in the subsequent posts Lorn. Thanks for reading it.
Originally posted by Lorn
Confluence areas in terms of fib retracement levels. Do you use these levels as confirmation of a trend or reversal levels?
Hey David,
Thanks for all the charts and comments. I like the idea that these fib lines show the proportionality the market likes to move in. Using them as pivot like areas is something I can see the value in.
Cheers!
Thanks for all the charts and comments. I like the idea that these fib lines show the proportionality the market likes to move in. Using them as pivot like areas is something I can see the value in.
Cheers!
thanks for putting in the effort here.....I'll have some questions for you later.....
when is a fib line no longer valid...?Do they become S/r for you David...meaning if we break a fib line that was support , then does that line become resistance for you or would you defer to another fib line for the true resistance...hope that is a clear question..thanks
If you look at the first chart, or any chart with appropriate fibs drawn, there are signals there. Yes, they can and do serve as S/R lines, at times. I really liked the way they were worked on that ascent from 1103 to 1099(see charts above). About as good as they get. Classic in terms of a basic understanding of them. That can be a beautiful thing that most don't use anyway. How many took advantage of a bounce right off the 50% level on a retrace at 1066, of the previous waves level? Was it worth an entry on a 5 min chart intraday? I doubt it looked like a promising risk/reward trade to most at the time without the fib levels there.
Another point is they tell you something when they don't act in the traditionally classic manner, if you're looking. An example on any chart is when the 50% level is sliced through like it's not even there. Is there a lesson to be gained from that?
I hope most would understand that the 50% level is the prime S/R level for any wave, but like a fib level one is looking at on a short term chart, they're contained within the bigger S/R levels of larger waves/patterns. I frequently point out 50% levels not because I believe they will stop price movement up or down. I point it out because there is strength above and weakness below this line.
Most are just disappointed because the fibs did not work like they expected them to do, as strong S/R levels, or pivot points for turns on the dime at that exact point. Therein is the "I use em", "I don't use em because they're unreliable" indifference most people generate for fib levels. When they're nothing, it's a signal too if you just look at the charts. There is usually another level above or below on that same chart that will be more important in that time and space of price movement.
Improper analysis and use of fib levels keeps traders from observing them as they build strength or show weakness. Certainly, we have seen stronger areas of S/R around certain fib levels whether mathematically important on intital development, or having been built up from repeated contact with price at close or distant times. The repeated contact is important. That is the basis of these posts. It also may not be about just what is happening on your 5 min chart intraday. There are other forces that can come into play that should have an effect on your decision making process.
The prime example I can give you is the DOW all time high 14,198. I'm sure there were a multitude of fib levels on hour charts and smaller at work. When the breakdown came, the retreat didn't end until the 50% retrace level at 7100 area. I'm sure those forces were operating on a much larger fib design than most wanted to comprehend. 100% from the conception to the top. 100+ years in time. Yet,even on that scale the forces worked. When did that level become valid. I would think the day 14,198 was reached and established as a top on a 1 min or tick chart. That level will be valid until a new all time high is reached that does more than marginally exceeding the previous high.
That is why I continually adjust my levels for what I see as time and price moves intraday. A new high. A new fib perspective.
I use fibs as decision points a lot. At least I have an idea for entry, exits, size, and stops.
The fibs are always valid is what I'm saying. Quit looking at the fib level for an answer. Watch the reaction price has, or doesn't have, at the fib levels for the true lesson of the use of fib levels. If price retreats, blows through, hovers, or stops on a dime. There's value in knowing where price is in relation to the levels and how it acts. I like knowing where the next step may or may not be.
Yes, sometimes fib levels act like a charm. I would suggest that is the exception for the most part or we'd all be using them and wealthy. Even as price reacts around a fib level, it can bounce around as the decision process unfolds. Add some other tools with them and the empowerment increases for making the right decisions at an appropriate time.
Lastly, let's look at a perplexing example. You have a short form some where above or at the break of the 50% level that has broken under the 50% level. Where to exit? A long off the 50% level could of had a stop at that level. No retrace yet and targets of 62, 68, 76, and 78%. No retrace in site and multiple targets below. That's why I use multiple tools and management skills, There is no easy answer except a known profit vs. an unknown path uually, if using fibs alone.
Other tools combined with the use of fibs add more to the ability to analyze what the decision should be in the tenor of the trade at that time.
I hope this answers some of what you were asking, if not all.
Emini Day Trading /
Daily Notes /
Forecast /
Economic Events /
Search /
Terms and Conditions /
Disclaimer /
Books /
Online Books /
Site Map /
Contact /
Privacy Policy /
Links /
About /
Day Trading Forum /
Investment Calculators /
Pivot Point Calculator /
Market Profile Generator /
Fibonacci Calculator /
Mailing List /
Advertise Here /
Articles /
Financial Terms /
Brokers /
Software /
Holidays /
Stock Split Calendar /
Mortgage Calculator /
Donate
Copyright © 2004-2023, MyPivots. All rights reserved.
Copyright © 2004-2023, MyPivots. All rights reserved.