anyone sell into 1345.25?
I did....more volume below...especially at the 41.75 area...lots of targets below...not gonna be easy though...this pig is still strong
trade with passion!!
trade with passion!!
a look at my volume chart ( left side histogram)and footprint you can see the 42.50 has only 1.6 % volume....the 44 had about 6.8 and the 41.75 had about 5.6%...so lets see if they can fill that low spot ( 42.50 ) in.
Click image for original size
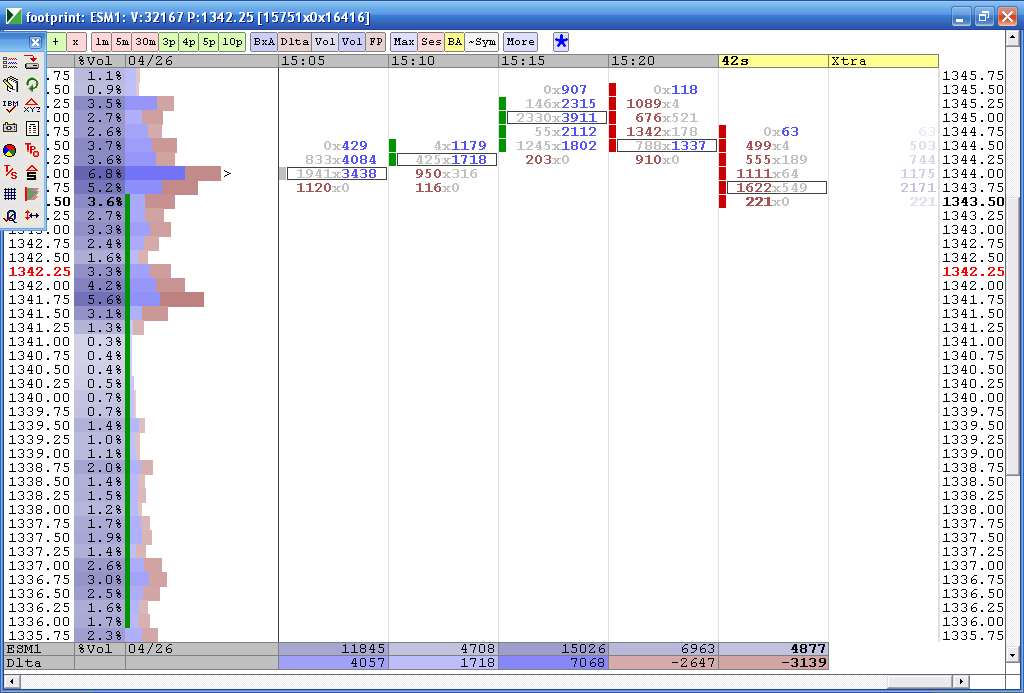
3 on and 3 off at 42.50 print.....just can never be sure with low volume
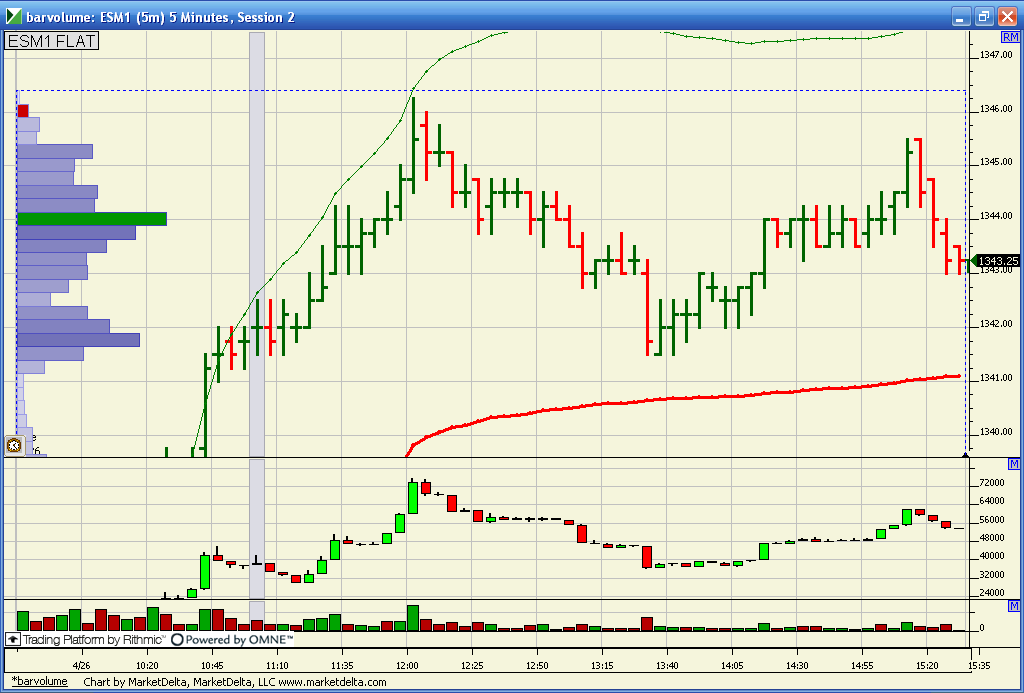
one for the road...here is my bar chart...just showing how the Peak volume flipped up to 1344 . Hope any one left and reading this ramble has a great evening!!
Click image for original size
Hi BruceM,
Replying to your request for a chart indicating the entry and exit patterns. Markets are mecurial. Applying inter-day price measurements (support / resistance and Fibonacci levels will put your capital at greater risk than monitoring the prospect of intra-day trades.
Applying the discipline of preparing the analysis to measure the potential of price move with respect to the Stretch and Fibonacci ratios, produces a disciplined written plan. Make a plan. Trade a plan. Trade from unchanged and measure with consideration for corrolating two or more measurements. Charts tend to bombard your senses with alpha waves and moving colored images. Both have been proven to reduce cognitive abilities.
1.) Trade from unchanged.
2.) Keep in mind the previous late B session price reversal (often last twenty to thirty minutes from the close) that measured 1.0% or 1.618% of the Stretch. Now consider any follow through into the next A session.
3.) Start considering if micro reversals may develop into the (3, -1) formula, i.e., -1 of (3, -1) is the first fade that corrolates to a 1.0% or a 1.618% of the Stretch calculation. Also keep in mind if follow through from the late B session, corrolates with 1.618% or 2.618% of the Stretch calculation.
Posted on my FB page.
YMM1 fade Strategy (3, -1) (profitable again): Trading from unchanged, 12324, 1st dip to 12424= -10pts. 12424+10=12434 to unchanged; 12434+10+10+10= 12464. 12463=Unchanged+1.618% of Stretch (29x1.618%=46)=12434+46 =12463. 12463-29-29-29=76. High=12469- 29-29-29 = 12382. (3, -1) worked for the first (3, -1) up by fading the first 29x.382=12423+11+11+11+11=12467.
Yesterday at 11:39am
A chart will assist your Stretch or Fibonacci of the Stretch measurement measuring, e.g., measuring from the follow through which is important as can be applied as a corrolative measuring tool to other early A session price move measurement objectives. is when you need to view the price reversal, i.e., high / low as measured as a Stretch or a Fibonacci of the Stretch. Trade from unchanged.
Bright, brief and gone: Start with measuring the previous price rotations (1.618% and 2.618% of the Stretch) from the late B session's price low / high. After the A session opens, identify if there is follow through or not, and patiently wait for the first small dip or bounce from the open. The question from there is determining whether the (3, -1) pattern [The -1 of the (3,-1) pattern fades] starts as a micro move from the open, and expands into a larger (3, -1) for the day (look for corrolating measurements). Whethjer it does or doesn't you'll measure a price measurement projection of 1.0%, 1.618%, etc., from unchanged.
Note: 4.25% of the Stretch calculation often correlates to the range. Check this out... 26 April... measuring from unchanged 12427 + 114 = 12541. 12560 = high. 12560 - 1.618% of the Stretch = 12560 - 43 = 12517. 12517 = 26 April settlement. Seeee!?! Seeee!?! The chart dwon't help my trading brother-from-another-mother. Usually you should look for a fudge factor around Stretch Fibonacci measurements. Nothing is fixed.
The rule of thumb-zilla (lol) is to trade from unchanged. Take the Stretch calculation, www.mypivots.com ... DAILY NOTES and chose the e-mini $5 Dow futures (YMM1), where you scroll to the bottom for each day's Stretch calculation. Multiply this Stretch calculation by 1.618%, 2.618% and 4.25%. Measure these numbers, the Stretch calculation and the respective Fibonacci ratios of the Stretch above and below unchanged. These are targets, but consider the news, which like today, rallied prices in a uni-directional pattern into the close. Usually you can expect these levels to be faded during early A session trading. mummble mummble more mummbling rubbish rubbish lol
As for the charts, ... in the event that I don't post a chart for you., ... www.cmegroup.com ... mouse over EQUITY INDEX ... click e-mini $5 Dow at the bottom. This is where you'll find the last, change, previous settlement, open, high, low and estimated same day volume. Click the tiny chart icon to the left of the LAST quote (not the 'V' but the 'rising bottoms line' icon). This is where you should change the chart TYPE: BAR to TYPE: CANDLESTICK.
Wow, that's heavy man !!! I just want you to post the numbers in advance...that's all. I really don't like to put any time or effort into any new trading ideas until I see it posted multiple times in advance or trades taken as they happen.
There is just not enough time to pursue all these trading ideas.
Perhaps you could pick a market that you will be trading tomorrow and just post the levels you will trade from. I'm always looking to seperate out those who like the markets from an academic pursuit and those who are in the trenches slugging it out to earn a living.
Hope I'm not offending you. Perhaps I'm just having a bad night!
Bruce,
Sorry you are having a bad night. The only market I trade and post comments about is the e-mini $5 Dow futures. Markets move faster than I can type, or post a chart. Giving the information in advance is like throwing a dart with a total disregard for money management. In each post I mention trading from unchanged, while considering corrolating price projection measurements, basis the Stretch and or Fibonacci ratios of the Stretch, around unchanged, including the last price reversal in the previous B session. My posts begin with YM and reflect a repeating pattern. I am trying to educate traders on a strategy that has been producing profits.
Hope that helps.
I am not trying to do the work them.
Emini Day Trading /
Daily Notes /
Forecast /
Economic Events /
Search /
Terms and Conditions /
Disclaimer /
Books /
Online Books /
Site Map /
Contact /
Privacy Policy /
Links /
About /
Day Trading Forum /
Investment Calculators /
Pivot Point Calculator /
Market Profile Generator /
Fibonacci Calculator /
Mailing List /
Advertise Here /
Articles /
Financial Terms /
Brokers /
Software /
Holidays /
Stock Split Calendar /
Mortgage Calculator /
Donate
Copyright © 2004-2023, MyPivots. All rights reserved.
Copyright © 2004-2023, MyPivots. All rights reserved.