ES MAP for 4-29-11
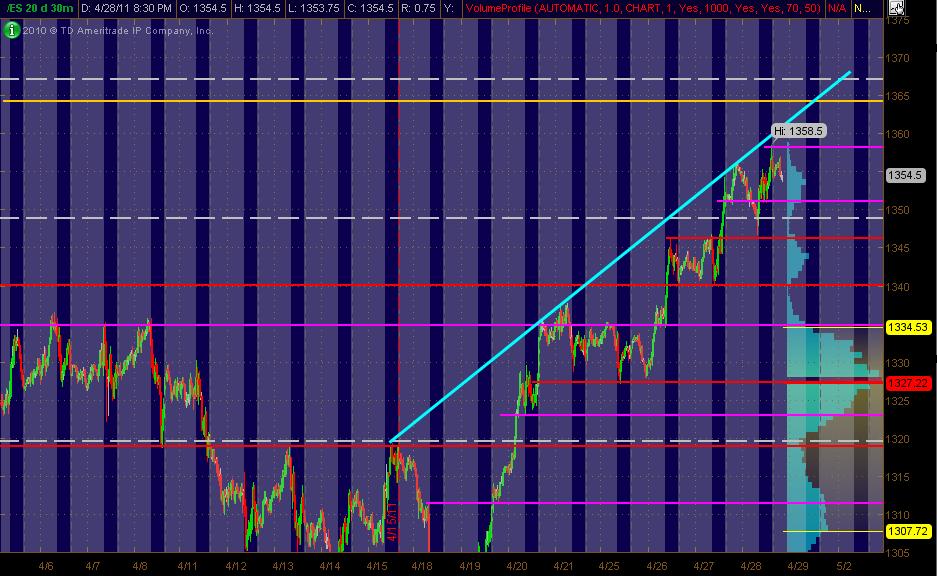
Here's what I've got looking at the ES 30min chart of 20 days. The Gray background is the "overnight" trading. The right vertical axis shows the 20-days worth of Volume at Price in Light Blue. The Red lines are my PASR "zones" of potential S/R with the Magenta potential semi-significant. The White dashed lines are the Weekly Pivots.
Have a Yellow line above the current market that looks like a potential significant Fib cluster area to me. Also, I've drawn in a Cyan trendline across the top swings of prices. I've adjusted some of the lines/levels/zones since the last posting of my "map". Hope it's helpful to both ES and equity traders!
Have a Yellow line above the current market that looks like a potential significant Fib cluster area to me. Also, I've drawn in a Cyan trendline across the top swings of prices. I've adjusted some of the lines/levels/zones since the last posting of my "map". Hope it's helpful to both ES and equity traders!
Click image for original size
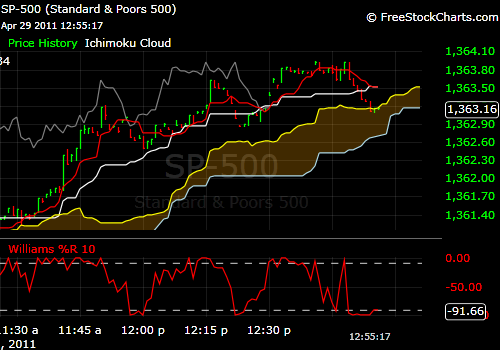
Man ,the ESis boring compared to the Euro!.. Made my goal for the day,but was hoping for one last trade before i get some sleep... cash s&p could be at short term support here...
Click image for original size
started new sells from 60.25....time to test a previous 30 minute low soon
hoping this ends with a pop and some volume selling to indicate a top, similar to yest... watching for spike to 62 area, 62.25= 60 min BO target, and 10 pt area from globex low and yest high vol 52.75, seems like nice area for profit taking....
Originally posted by BruceMcertainly not laughing at you Bruce, but that is a crappy way to get a test of prev 30 min low, put in a 4 tick 30 min candle and then test it.....
started new sells from 60.25....time to test a previous 30 minute low soon
no problem Chris..I added at 60.50...That is a terrible low at 59.50,3 - 30 minute bars lows there...divergence in volume and CD and a few others...1.5 times the IB is here....but no doubt a tough trade...we'll see
57.75 - 58 is my next target for runners...don't have much to work with up here but that is VWAP and peak volume...gotta get under Yesterdays highs
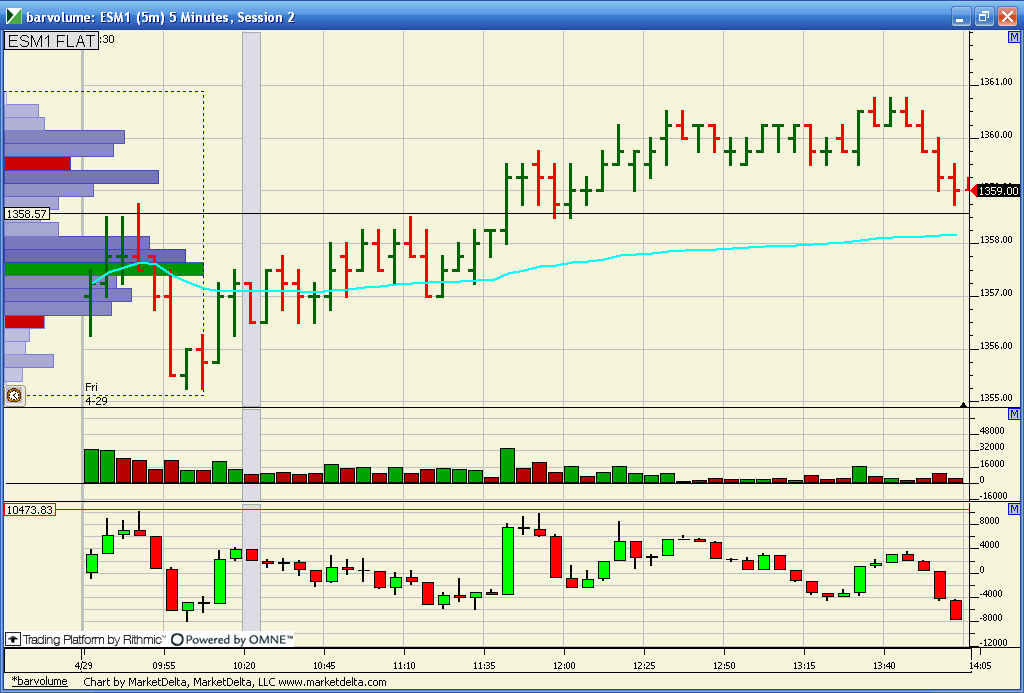
most important here is what CD is doing or did....Look how we went up but CD never came above the highs from the first 15 minutes of the day and also the highs of the 11:45 ( approximately)
Everything else is old stuff...Volume diverged and look at the big green Histogram bar with all that volume at 57.75...
either quick or dead in such tight ranges..I don't trade for triples on the highs...they have no good track record...but it certainly implies that sellers didn't enter very quickly...
sometimes they just like to test the trend and then the buyers step in below previous 30 minute lows..
Click image for original size
so lorn...in your world what does it mean when CD is on fresh lows but price is so far above it's lows.....?? any hints ?
that 59.25 is working hard to become the new peak volume price.. it will be interesting if we flip higher on the peak volume but the delta stays negative...looks as if delta is becoming more negative at that number so hopefully all those who bought there earlier are exiting and we will get a good rollover down
Bruce, Hint: we are in an uptrend AND at end of the month....lol
wow, now that is what I call dumb luck as an exit...!! I guess they like that 57.50 !!
Emini Day Trading /
Daily Notes /
Forecast /
Economic Events /
Search /
Terms and Conditions /
Disclaimer /
Books /
Online Books /
Site Map /
Contact /
Privacy Policy /
Links /
About /
Day Trading Forum /
Investment Calculators /
Pivot Point Calculator /
Market Profile Generator /
Fibonacci Calculator /
Mailing List /
Advertise Here /
Articles /
Financial Terms /
Brokers /
Software /
Holidays /
Stock Split Calendar /
Mortgage Calculator /
Donate
Copyright © 2004-2023, MyPivots. All rights reserved.
Copyright © 2004-2023, MyPivots. All rights reserved.