ES Day Trading 6-1-2011
Some early observations.
Divergence between ES and NQ at there respective O/N highs as NQ surpassed the 8:00pm highs made while ES did not.
ES has now traded back to yesterday's POC of 1337.75 and trying to stabilize.
1338.25 is the 2.618 projection down off the 30-min initial move. 1333.25 is YD RTH low while just below that is 4.236 projection of 1332.25 off the 30 min initial move down.
CD divergence at the high also indicates to me O/N inventory is currently short. Do they have the strength to keep prices going lower?
that;s two sets......I want final exit at 31.25...that is original initiation point for me and that fills in second set of singles
not to sound like a broken record, but great trading bruce !
that's me flat on all at 30.75...not caring about one- two tics now....beautiful single print fill
gotta run..hope all have a great day
gotta run..hope all have a great day
long based on stretch number X423 at 1328.40 , Dow blew past its 423
thanks...appreciate it...hopefully some can see how that 30 ( a peak volume and pronunced POC) is a tricky spot to initiate at....It is much safer to use those as targets.....
I think that many times they know how people are trained to buy and sell right at them...
In this particular case we blew through it so I was trading for the retest from below.....and as usual, I was early up at the 31.25 buys just in case the POC players where going to win....they didn't win today.
another filter I always like is the 2 - 5 point range beyond key areas....they know that many smaller traders who were buying the 30 would use a 2 - 3 point stop....so after they take their money out, the market will often go up..once the small traders finish selling out the losers then there is nobody left to really sell so we go up.....just an unproven theory but if we combine that with the single prints then we have some good odds for a rally...or at least a mini up move
It is always safer to initiate in low volume when we have high volume near by...I'll use this morning fades as an example in the next post
Originally posted by apk781
not to sound like a broken record, but great trading bruce !
If we look at Lorns chart you can see the "holes"( low volume) and then ABOVE that we have the 42.50 - 43.25 area as high volume..
so in my last post I said it was safer to initiate in low volume and traget high volume...so in the day session the faders are using this low volume to look for shorts and will either add or take the loss in the high volume zone above up near 43.25 if it printed....
Most times you will see a high volume zone and then we get a break away from that volume zone and we get the low volume moves...
The ideal low risk trades will come at the edges of ranges and at the edges of the low volume zones..
Look at right now.... many sold the 31.25 single prints knowing peak volume was above at 32 area ..hope some of that makes sense
Originally posted by Lorn
O/N profile. Ugly hole there between 40-42 in the volume.
Click image for original size

I'm a fader so I look for Low volume to fill in off range extremes so these examples are not specifically how I trade...I just want to point out the low- high volume combination concept...
The high volume builds up pressure and when that pressure is released it leaves low volume in it's wake..
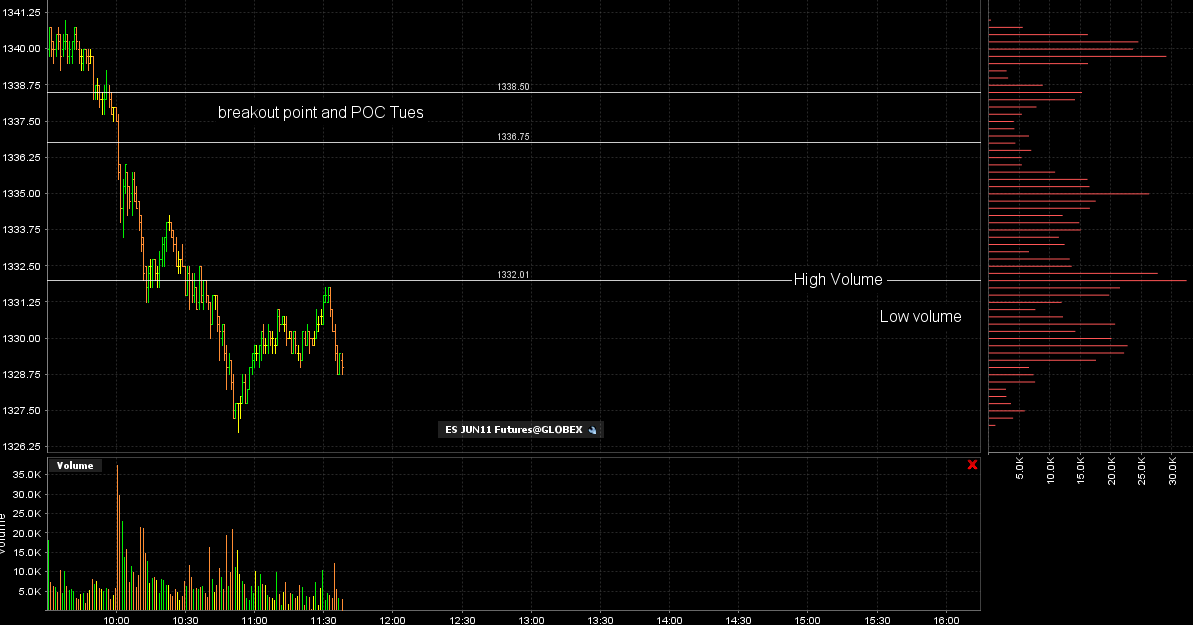
here is how we look right now...we have high volume at 32.50 that built up pressure and then the pressure was released to the downside leaving low volume..
I wait for the low pressure to end ( in this case the selling and take the fade for any retrace back...) somebody who is more nimble could do both syles of trading......I'm not good enough or quick enough for both
here is the current chart...ignore the text up at 36 - 38 area..important part is to look at the histogram on the right which shows the High and low volume combination..I gotta run..good day all
The high volume builds up pressure and when that pressure is released it leaves low volume in it's wake..
here is how we look right now...we have high volume at 32.50 that built up pressure and then the pressure was released to the downside leaving low volume..
I wait for the low pressure to end ( in this case the selling and take the fade for any retrace back...) somebody who is more nimble could do both syles of trading......I'm not good enough or quick enough for both
here is the current chart...ignore the text up at 36 - 38 area..important part is to look at the histogram on the right which shows the High and low volume combination..I gotta run..good day all
Click image for original size
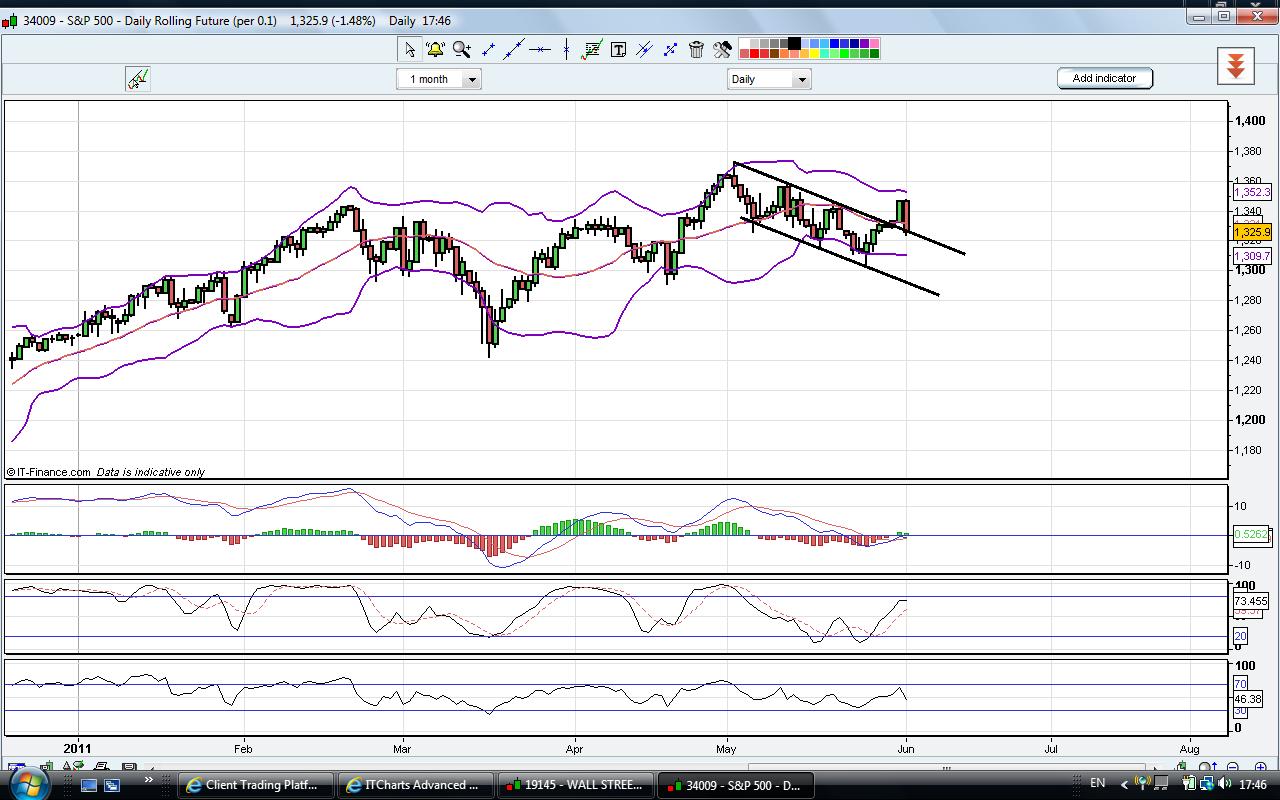
the bigger picture, slaps to myself for not checking the hourly chart as well, was over bought with divergent highs so was at risk of a pull back
Click image for original size
Originally posted by Silverharp
long based on stretch number X423 at 1328.40 , Dow blew past its 423
Does this "Stretch" strategy extend from every bar's open or just the day's RTH open?
I am shorting here on 23.50 looking for 21.00
the poc based on time has shifted lower so we may need to go down to find buyers
Emini Day Trading /
Daily Notes /
Forecast /
Economic Events /
Search /
Terms and Conditions /
Disclaimer /
Books /
Online Books /
Site Map /
Contact /
Privacy Policy /
Links /
About /
Day Trading Forum /
Investment Calculators /
Pivot Point Calculator /
Market Profile Generator /
Fibonacci Calculator /
Mailing List /
Advertise Here /
Articles /
Financial Terms /
Brokers /
Software /
Holidays /
Stock Split Calendar /
Mortgage Calculator /
Donate
Copyright © 2004-2023, MyPivots. All rights reserved.
Copyright © 2004-2023, MyPivots. All rights reserved.