Weekly ES Prep Work
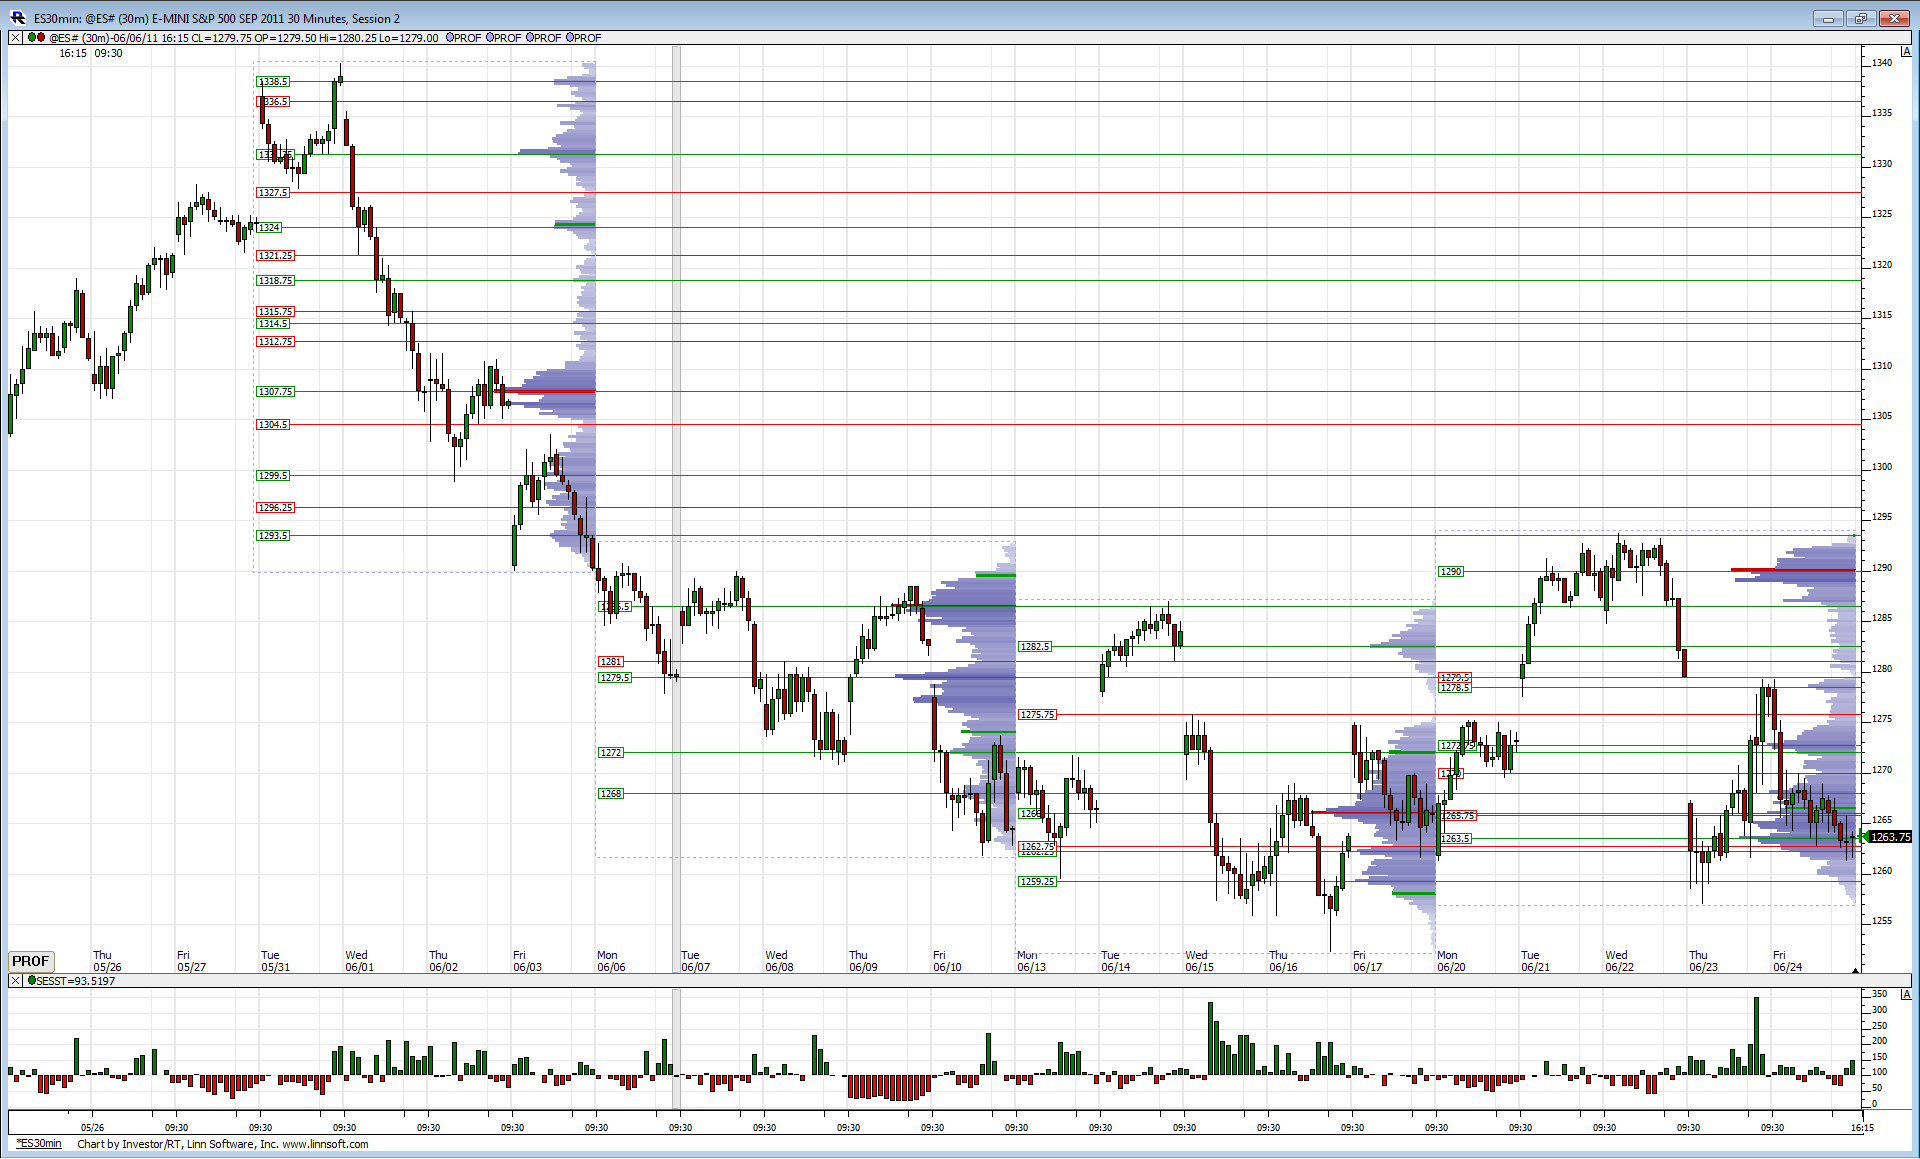
Attached is a chart with volume profiles drawn across the last four weeks. The chart is big, I know, hope everyone can see it. Something useful to gleam is the difference between the first week and the last three. Notice the first week is basically straight down in terms of price and the profile shows no real volume bulges except around 1307 area. Classic trending profile pattern, meaning price will move in a given direction until volume is willing to come in.
Now the next three weeks are quite different, they show volume bulges on both the highs and the lows. Essentially its been a big 40 pt trading range over the last three weeks.
So, we had real selling (or at least long covering) from the first week of June, then prices have gone sideways. The 1293.75 high from last week and the 1252.25 low of the week prior are extremely important resistance and support in my view and we need to be highly conscious of them when revisited to tell us if that selling from the first week of June is still the major controller or if a rotation has occurred back into bullish hands.
Just one way to look at things.
Click image for original size
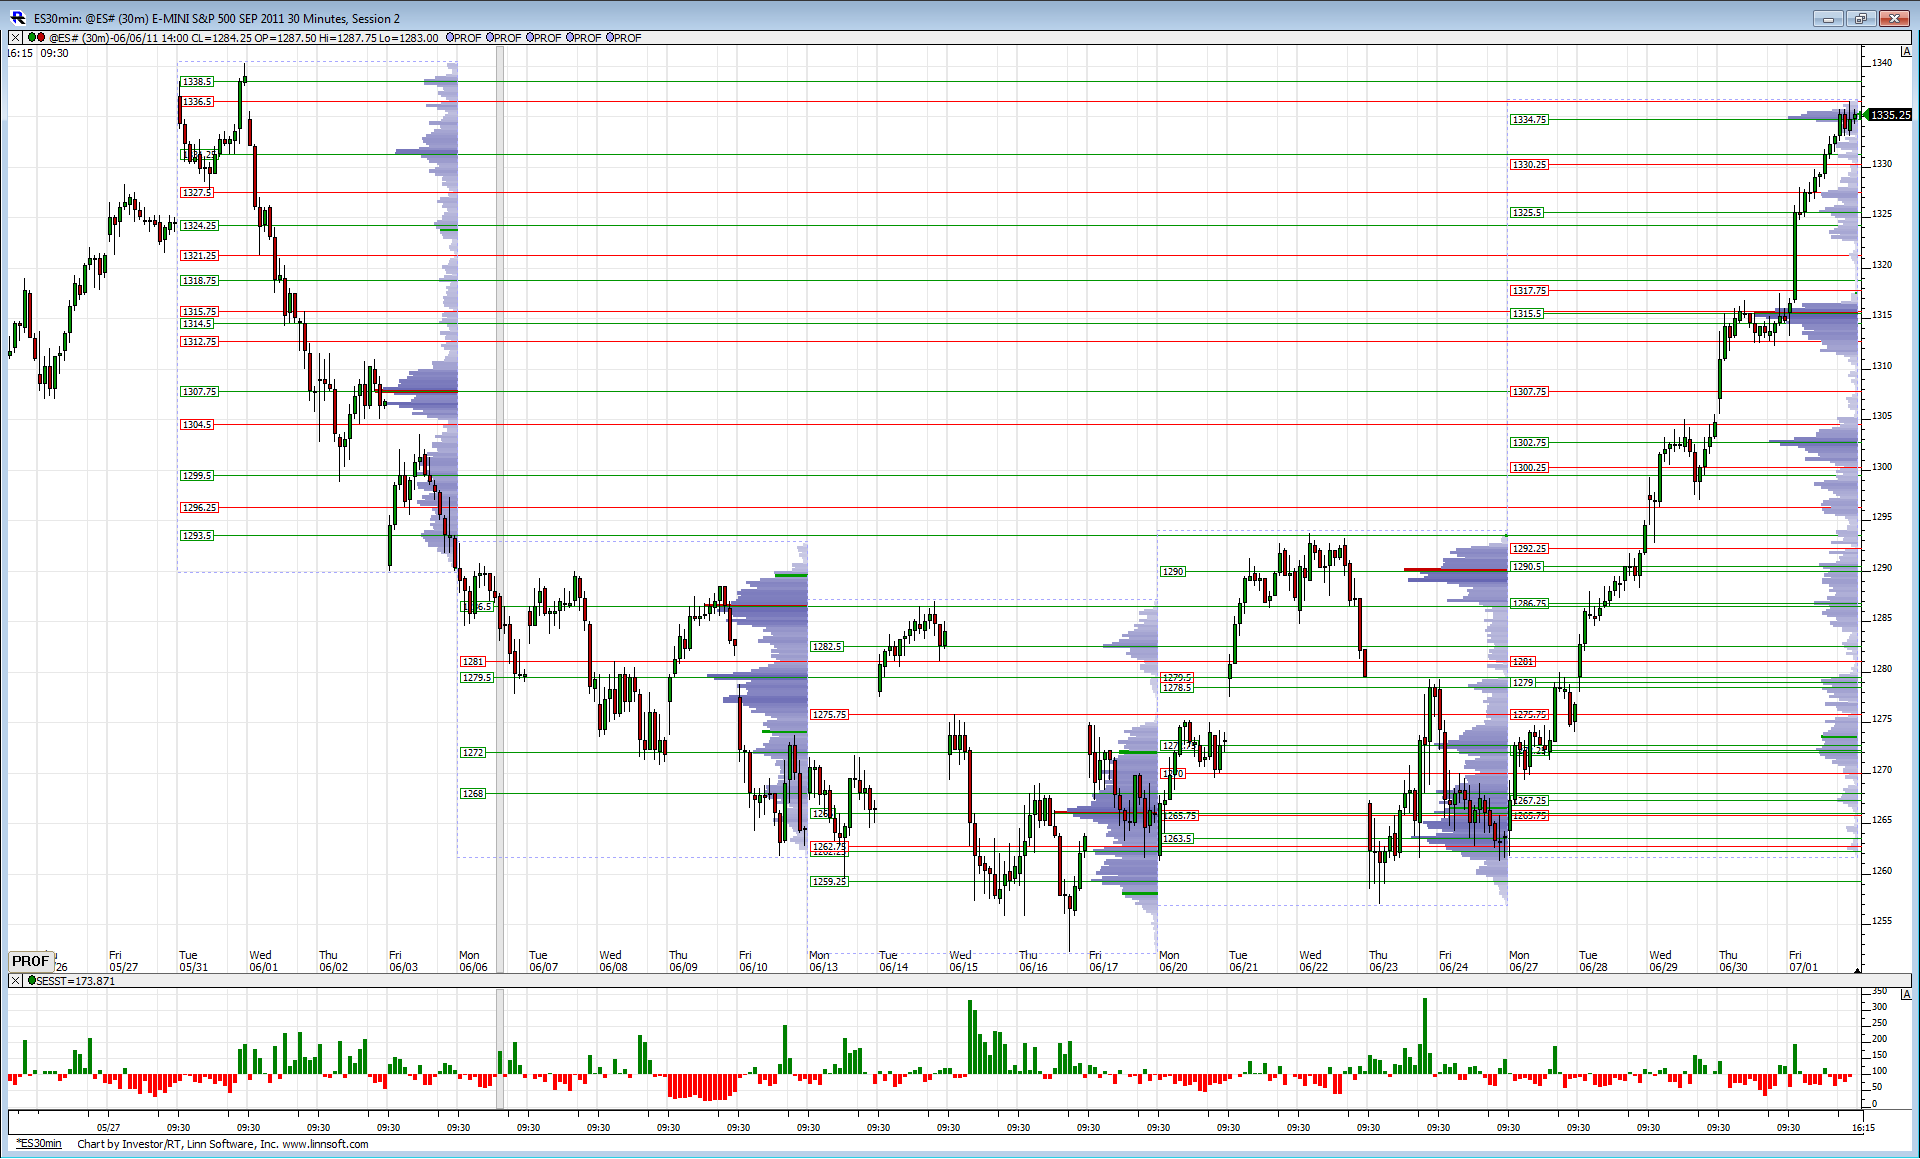
Here is this 30-min RTH chart again. Weekly profiles drawn next to each other.
Just a little bit further and the down gap from 6-1 will be filled at 1339.
Friday's high came right on the LVN of 1336.50 (red line) set from the first week of June. Not sure if that really means much but its worth noting, at least from the point of view prices seem to be aware of these Volume Nodes that were set from that first week of June. All the little consolidations from last week when prices broke above 1293.75 have come on one of these Nodes.
That 5-31 high of 1340.25 (O/N high set on 6-1 of 1342.25 and not hit in RTH) is now the BIG resistance point. Seems from this past weeks price action that resistance should be no problem to overcome but one thing I've learned its usually what traders expect the MOST that DOESN'T happen.
"Some of the biggest trading opportunities occur when a market attempts to do something and it fails." - James Dalton.
Lets keep that in mind heading into Tuesday.
Click image for original size
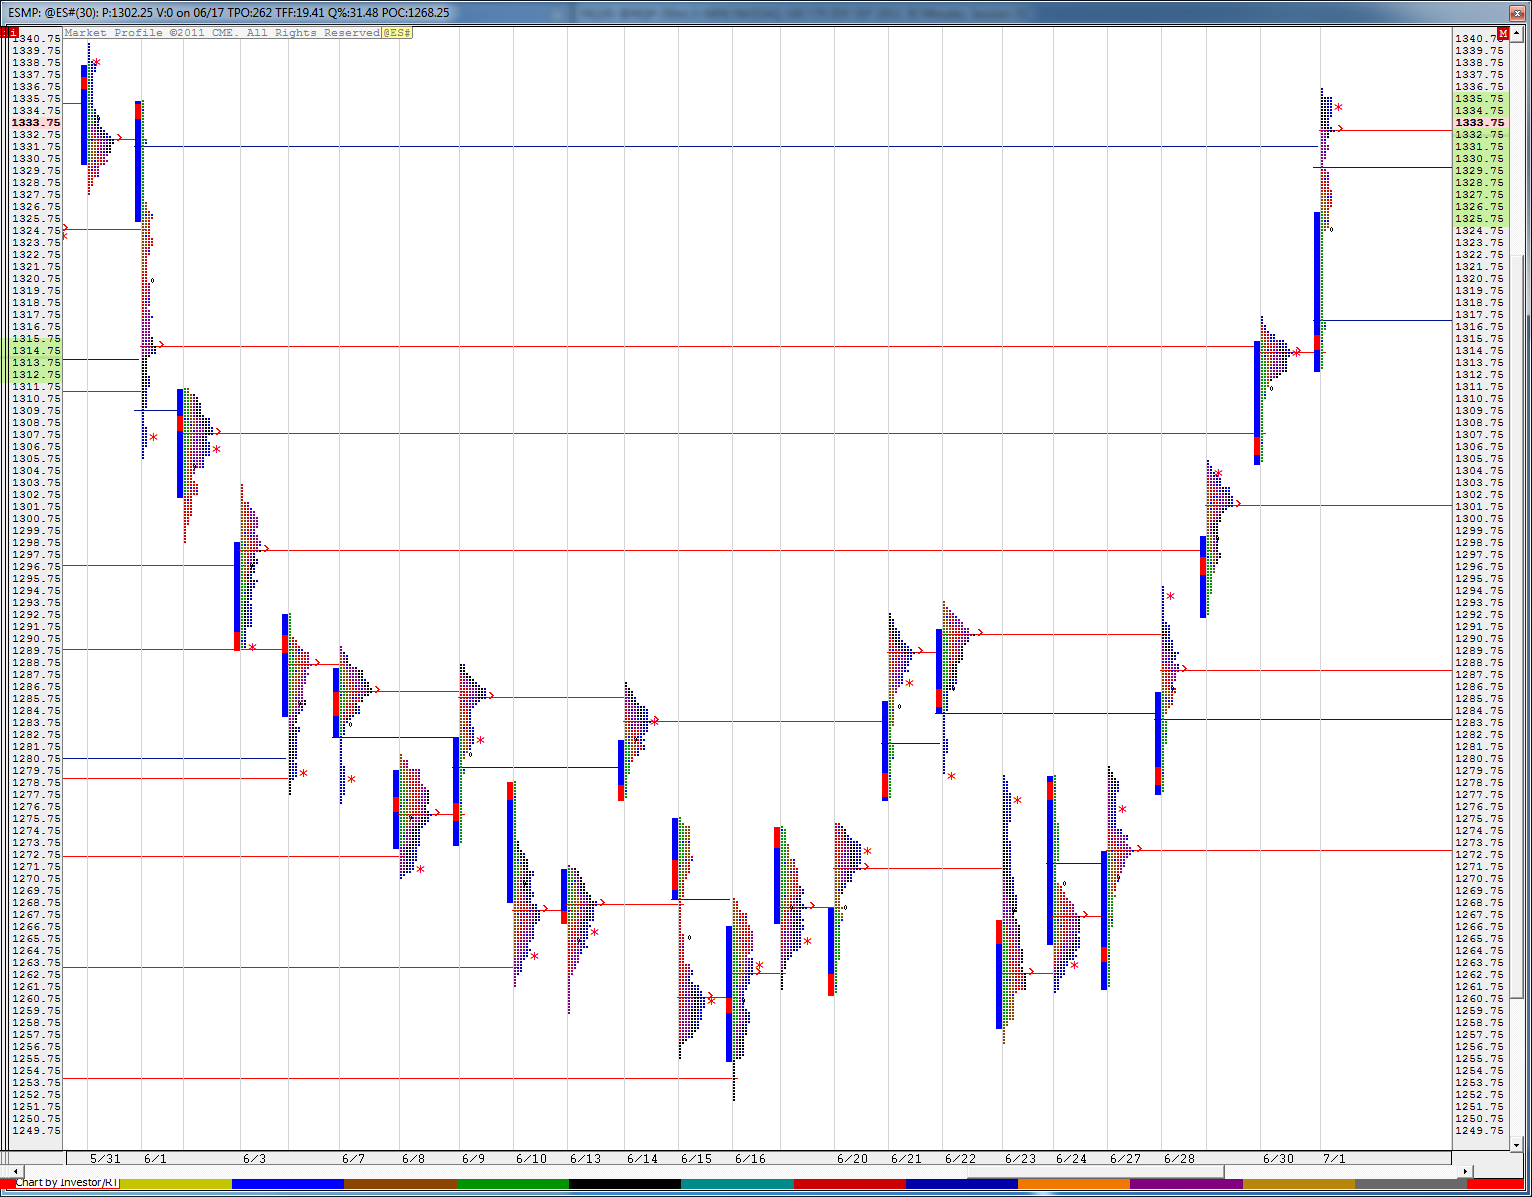
Here is a look at an MP chart for the month of June including 7-1. What jumps out at me is the transition from neutral trade (6/9-6/27) to trending trade in the last week. We also had trending trade in the first week of June. So a good lesson to take from this is the market rotates from trend, to non-trend back to trend. One never can truly know how long each type of action will last be at least we can be aware of the possibilities.
Click image for original size
as usual you are a piece of work Lorn...OOPPS, I mean a great piece of work...thanks for those charts
Connors Vix on sells now and 2 period RSI up near 98..so this thread may be a good place for that kind of stuff.......wow...way overbought...will get some charts up later
Connors Vix on sells now and 2 period RSI up near 98..so this thread may be a good place for that kind of stuff.......wow...way overbought...will get some charts up later
thanks for the charts, they're terrific (with your explanation/analysis)
I was wondering, re the LVN that was hit on Friday. That was generated way back at the beginning of the month (36price level)
Did you physically put that horizontal red-line on the chart or does your software automatically do it.
I was wondering, re the LVN that was hit on Friday. That was generated way back at the beginning of the month (36price level)
Did you physically put that horizontal red-line on the chart or does your software automatically do it.
That line is put on by the software. I can adjust the sensitivity to get more or less lines but that 1336.50 red line has been sitting on my chart since Friday June 3rd. Not suggesting I had any idea we would trade all the way back to it.
Originally posted by PAUL9
thanks for the charts, they're terrific (with your explanation/analysis)
I was wondering, re the LVN that was hit on Friday. That was generated way back at the beginning of the month (36price level)
Did you physically put that horizontal red-line on the chart or does your software automatically do it.
Originally posted by BruceM
as usual you are a piece of work Lorn...
I try to keep all the pieces from coming apart but doesn't work most of the time...
Emini Day Trading /
Daily Notes /
Forecast /
Economic Events /
Search /
Terms and Conditions /
Disclaimer /
Books /
Online Books /
Site Map /
Contact /
Privacy Policy /
Links /
About /
Day Trading Forum /
Investment Calculators /
Pivot Point Calculator /
Market Profile Generator /
Fibonacci Calculator /
Mailing List /
Advertise Here /
Articles /
Financial Terms /
Brokers /
Software /
Holidays /
Stock Split Calendar /
Mortgage Calculator /
Donate
Copyright © 2004-2023, MyPivots. All rights reserved.
Copyright © 2004-2023, MyPivots. All rights reserved.