ES Thu 8-4-11
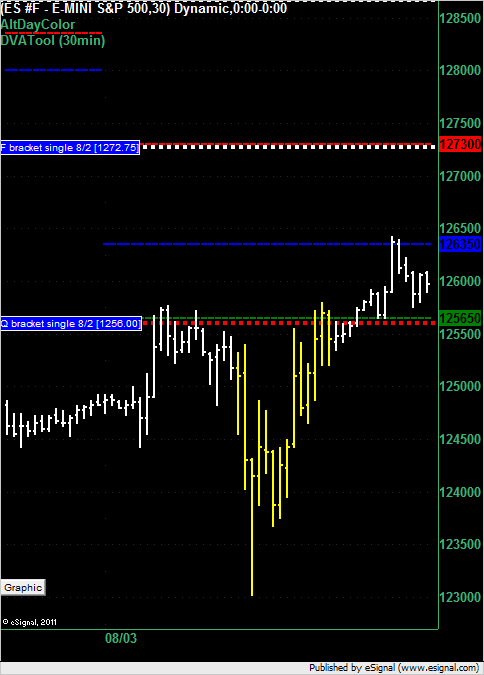
Depending on how you used Tuesday's single print at 1256.00 in Wednesday's trading you wouldn't have lost money had you used it to short late in the day but you wouldn't have made much either. Had you shorted at 1256 even you would have had a draw down of 2 points and a best run up of 4 points.
Had you used it as a target from a long during the day then you would have been golden as it was 2 points off the high. That single print is no longer in play but the F bracket from Tuesday at 1272.75 is still above us and is a target and a reversal point.
Had you used it as a target from a long during the day then you would have been golden as it was 2 points off the high. That single print is no longer in play but the F bracket from Tuesday at 1272.75 is still above us and is a target and a reversal point.
Click image for original size
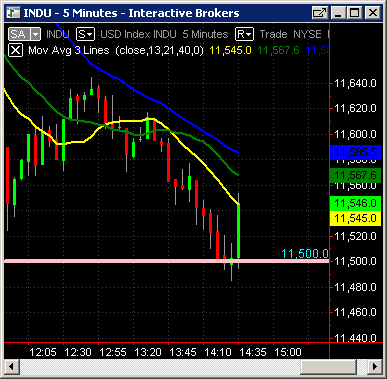
1212.25 needs to hold
INDU 30-min
Click image for original size
Originally posted by ayn
prestwick, i am curious, after the 23 level did you have any projections that fell around the 12 area? also, what level did you use to measure the projection up after the bounce from 12.25? any rules you follow on the extension of the move up or down you use to measure the fib extensions?
thank you
Originally posted by prestwickdrive
We got the 23.25. If you are like me you would have doubted that projection, especially when we retraced to 47.75, as I used to but I have seen them hit way too often to ignore any more. Those projections also work really well for crude oil and natural gas on inventory days which is where I primarily use them.
Ayn,
Once 23.25 was taken out I looked for the next cycle low below the 1239 I used for the first projection. That was 1236 and it gave a full projection of 1215.25. Whenever a projection is exceeded that's what KB used to say to do ... measure the next cycle. In this case we blew by it by 2.75 points.
Another thing I do is measure off of sebsequent cycles. The next major one had a high of 1247.75 and low of 1232.25 which was the over run of the hit of the first initial projection. That gave an initial projection of 1222.5 (which was pretty much of a bust as a location of a counter trade but a great short target) and a full projection of 1207.25 which we just about hit a few minutes ago.
From the 12.25 I used 17.75 as the cycle high for an up projection. It yielded a full of 26.75 which we exceeded. Once that was exceeded I looked for the next cycle high off 12.25 which was 18.75 yielding a full of 29.25 which failed when we retouched 12.25. My favorite moves to measure are trhe extreme ones like after news instead of the grinders.
On an extreme move day like today KB used to like to measure cycles on longer time frame candles to make it easier to visualize.
Another thing to watch for on a day like today is failure of projections in any direction - such as up projections today. When that happpens the market is scfeaming to you that it still wants to go the other way.
I hope this helps and if KB is lurking out there please correct any errors.
Low volume node hit. I do not know how Bruce posts and trades... he is a giant
Click image for original size
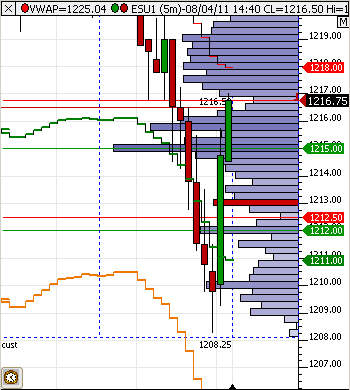
FWIW, the last cycle high before the current up move was 19.25. The initial move down off it to the next green candle got to 16.0. that yielded an initial projection of 14.0 which (was a hit) and a full of 10.75. We just topped 19.25 so the projection to 10.75 is a failure.
Since we have not taken out 8.25 up projections to 22.5 and 31.25 are still valid.
Since we have not taken out 8.25 up projections to 22.5 and 31.25 are still valid.
thanks
Originally posted by prestwickdrive
FWIW, the last cycle high before the current up move was 19.25. The initial move down off it to the next green candle got to 16.0. that yielded an initial projection of 14.0 which (was a hit) and a full of 10.75. We just topped 19.25 so the projection to 10.75 is a failure.
Since we have not taken out 8.25 up projections to 22.5 and 31.25 are still valid.
last BIG day down we had was flasah crash day
- that day we rallied pretty sharply back but still closed over 40 points
down
- that day we rallied pretty sharply back but still closed over 40 points
down
the foot prints must be going nuts
Della, you would not believe it, but it is all low volume prints - I find it confusing..
round number maynot hold
1196 and 1190 1st 2 sub 1200 targets
Emini Day Trading /
Daily Notes /
Forecast /
Economic Events /
Search /
Terms and Conditions /
Disclaimer /
Books /
Online Books /
Site Map /
Contact /
Privacy Policy /
Links /
About /
Day Trading Forum /
Investment Calculators /
Pivot Point Calculator /
Market Profile Generator /
Fibonacci Calculator /
Mailing List /
Advertise Here /
Articles /
Financial Terms /
Brokers /
Software /
Holidays /
Stock Split Calendar /
Mortgage Calculator /
Donate
Copyright © 2004-2023, MyPivots. All rights reserved.
Copyright © 2004-2023, MyPivots. All rights reserved.