ES Fri 9-9-11
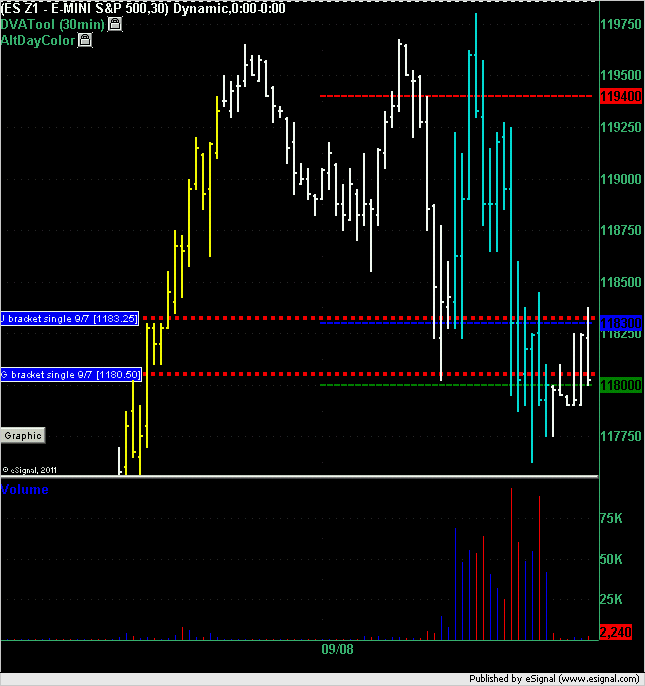
Market Profile summary from Thursday action. Note that you are looking at the December contract on this chart and not the September or continuous contract. i.e. the single prints you see on this chart that were generated on Wednesday you would not have seen on Wednesday because you would have been looking at the September contract.
The market opened above the Wednesday's J bracket and traded down to it triggering a long at 1183.25. Draw down on this trade was 1 point to 1182.25 in the following bracket which was then followed by a best run-up of 14.75 points to the high of day of 1198 even.
The market dropped through that single later on in the day and hit the second single which triggered a long at 1180.50 which had a draw down of 4.25 points to the low of the day of 1176.25 and a best run up of 5.5 points to 1186 even. Using a 4 point stop and a target greater than 5.25 points would have made that trade a loser. Note however that the run-up of 5.5 points happened before that 4.25 point draw down so most traders would have trailed a stop to breakeven by then.
Click image for original size
specific first part of zone is 47.50...hitting into it now..air pocket up in 52.50 area
that's 2 sets of singles so good odds we go back to 53.75 !!!
at least from a statistical view!!
at least from a statistical view!!
just because we made new lows it doesn't change the probability for me and the 53.75...but I'll settle for 52.50....and will continue poking at longs down here
why do I have a feeling that nobody is really gettin me ??????? LOL!!
the day is now officially over for me ...I have a shed to build.......
if you stay and play u may want to remember the concept of the neutral day
the day is now officially over for me ...I have a shed to build.......
if you stay and play u may want to remember the concept of the neutral day
"just because we made new lows it doesn't change the probability for me and the 53.75...but I'll settle for 52.50....and will continue poking at longs down here.."
i dont have the power to hit u up..so this is why i post this to say thank you.and i again would like to thank everyone that does post..now i will go back to lurking..
have good weekend all
take care
duck
i dont have the power to hit u up..so this is why i post this to say thank you.and i again would like to thank everyone that does post..now i will go back to lurking..
have good weekend all
take care
duck
Click image for original size
Click image for original size
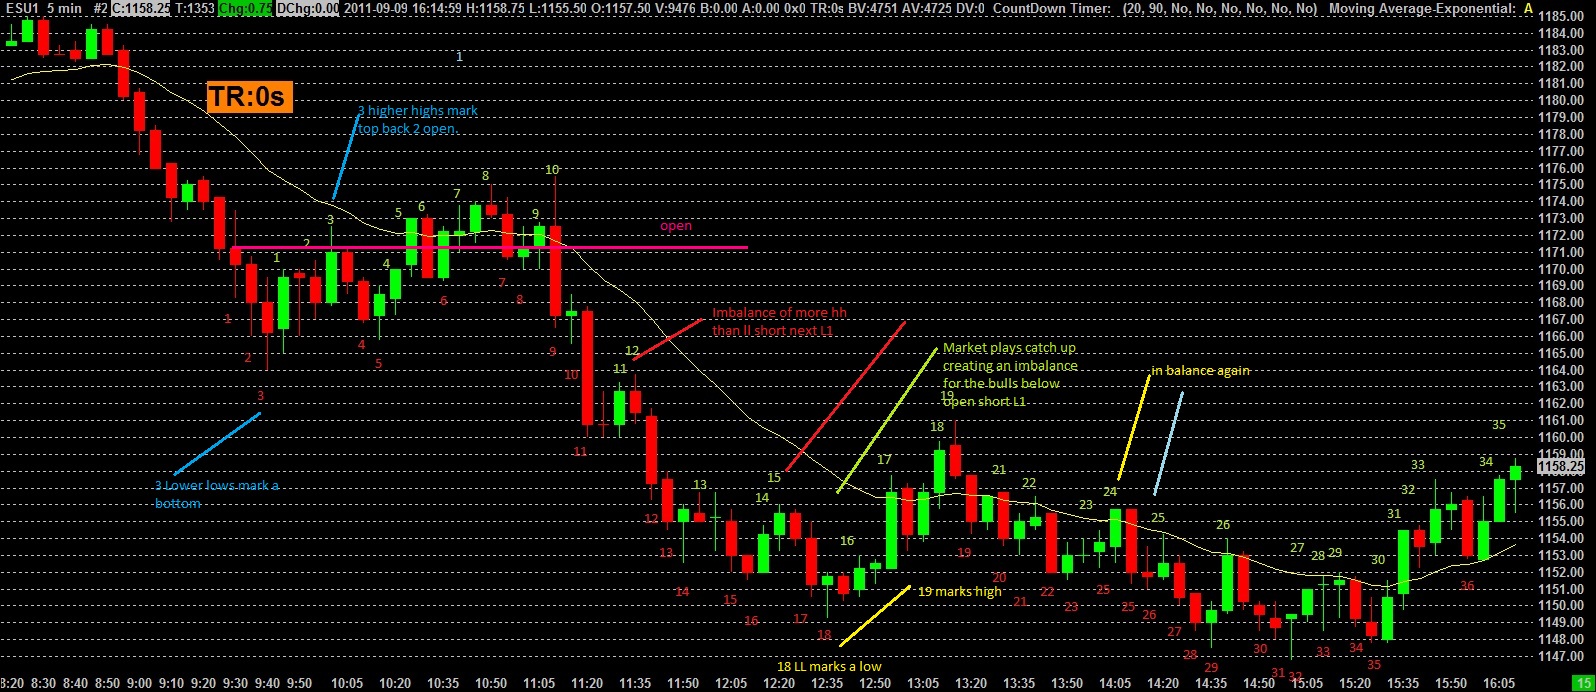
Markets spend almost the same amount of time "trying" to go ups as they do going down.
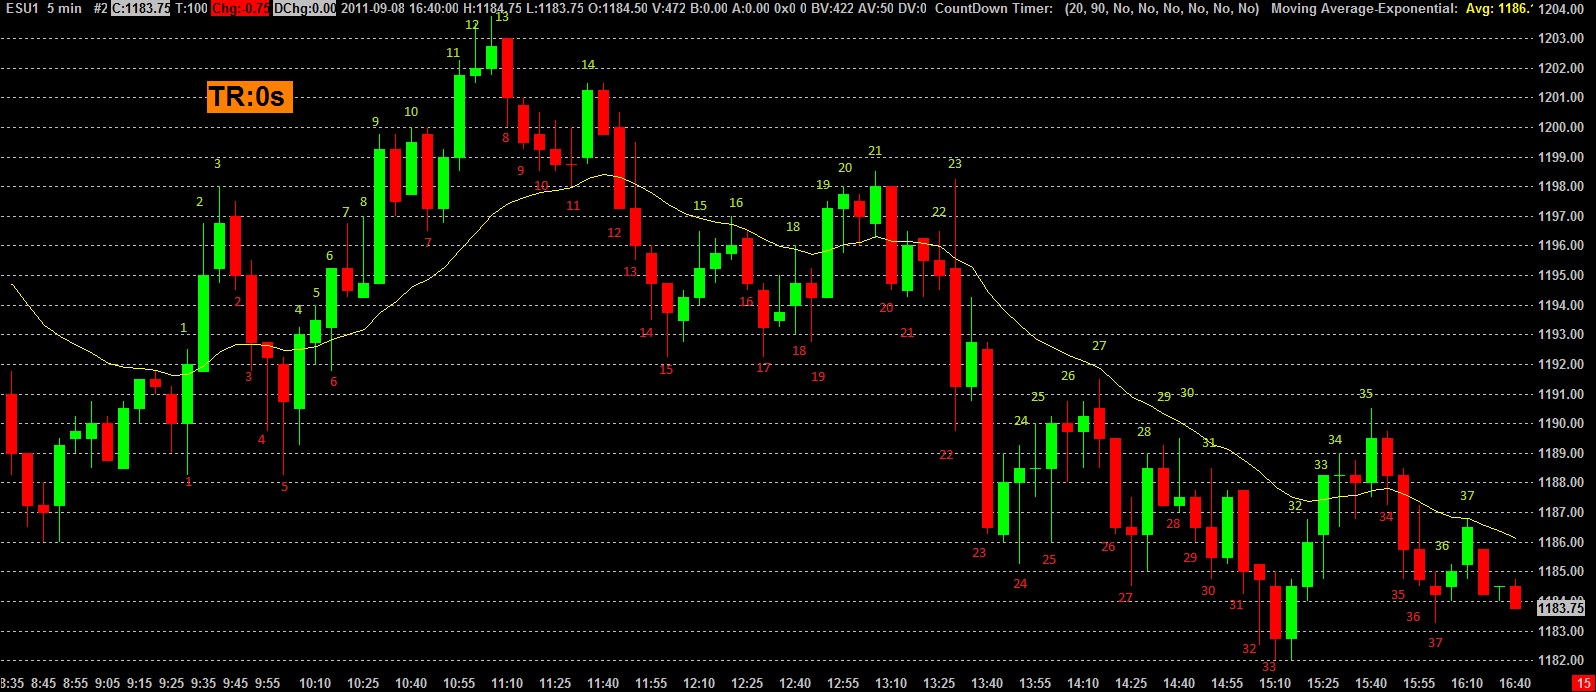
The last post is the wrong chart. Thin that was Thursdays chart.
Click image for original size
Joe...
fantastic post, very interesting concept to add to a strategy... I haven't done any back study yet... is there a # out of balance that you have found to be outer edge of "out of balance"? once again thanks for the post and the charts
fantastic post, very interesting concept to add to a strategy... I haven't done any back study yet... is there a # out of balance that you have found to be outer edge of "out of balance"? once again thanks for the post and the charts
chris
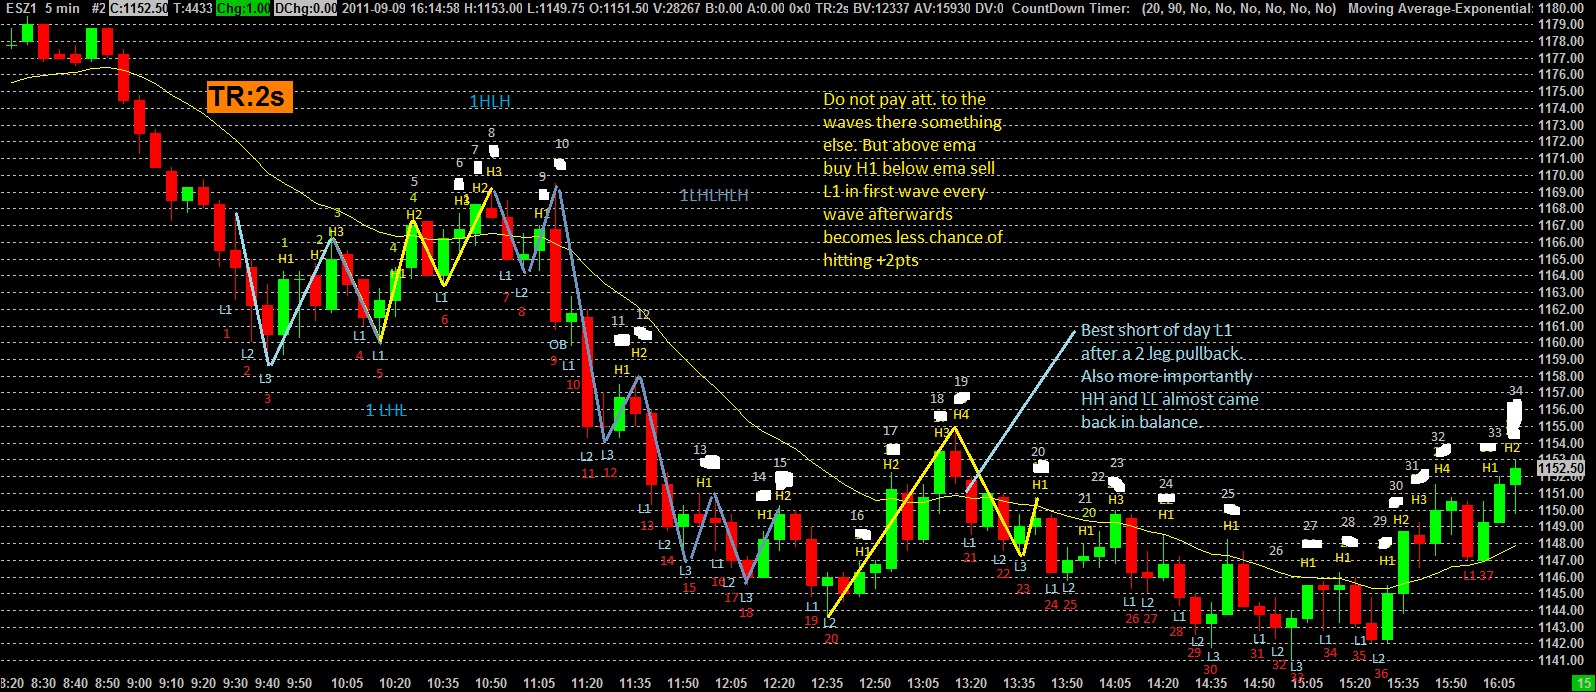
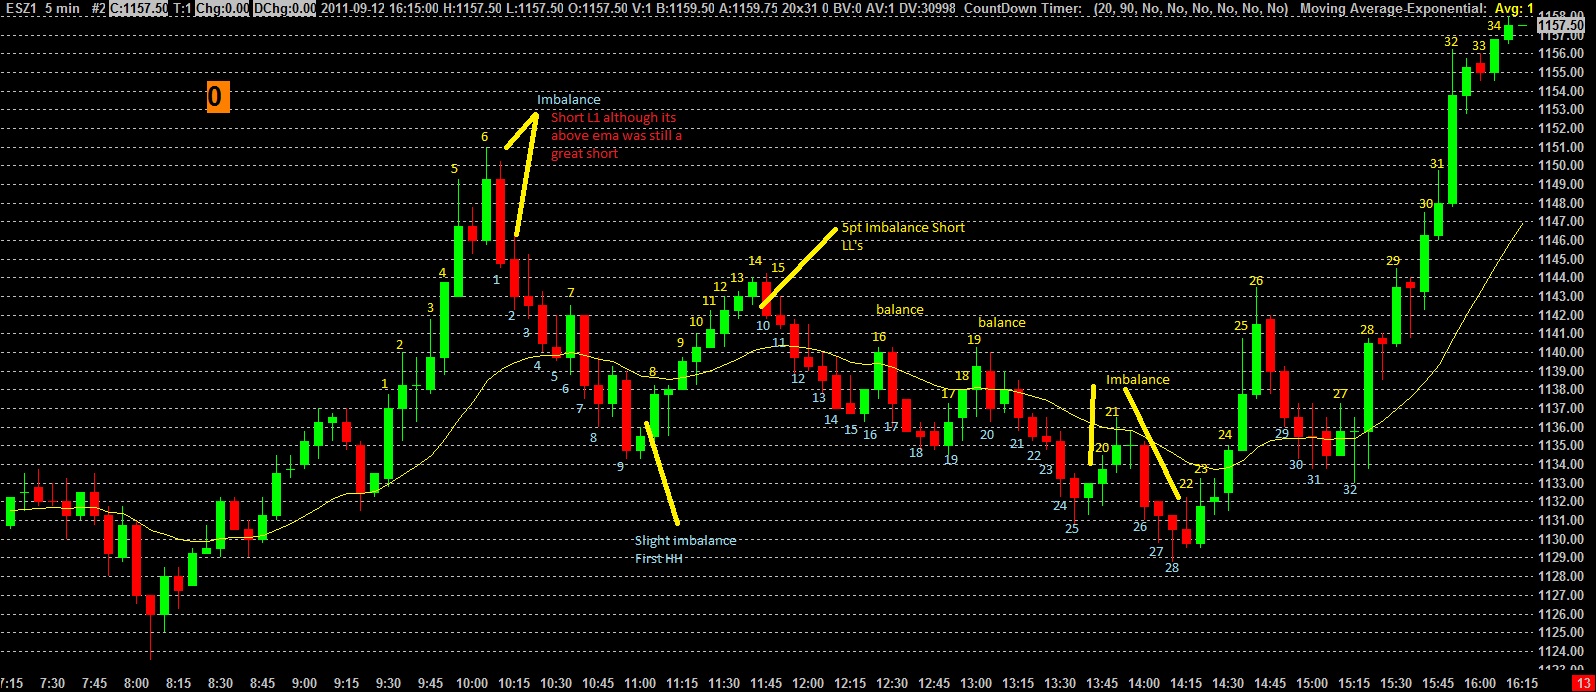
Just trading price action (correctly) is all anyone has to do to make a good living. The concept is bulls and bears only have so many opportunities to push the market in there direction are they doing a good job or wasting there HH's on a one tick
Just trading price action (correctly) is all anyone has to do to make a good living. The concept is bulls and bears only have so many opportunities to push the market in there direction are they doing a good job or wasting there HH's on a one tick
Click image for original size
Emini Day Trading /
Daily Notes /
Forecast /
Economic Events /
Search /
Terms and Conditions /
Disclaimer /
Books /
Online Books /
Site Map /
Contact /
Privacy Policy /
Links /
About /
Day Trading Forum /
Investment Calculators /
Pivot Point Calculator /
Market Profile Generator /
Fibonacci Calculator /
Mailing List /
Advertise Here /
Articles /
Financial Terms /
Brokers /
Software /
Holidays /
Stock Split Calendar /
Mortgage Calculator /
Donate
Copyright © 2004-2023, MyPivots. All rights reserved.
Copyright © 2004-2023, MyPivots. All rights reserved.