ES Thursday 10-6-11
Here is a recap chart from Wednesday. I'm going to get the date right tonight. Very instructive day and was hoping we'd have some good examples this week. You may want to reference Mondays and Fridays chart to understand this a bit more as those "bell curves" interacted nicely with todays trade.
Click image for original size
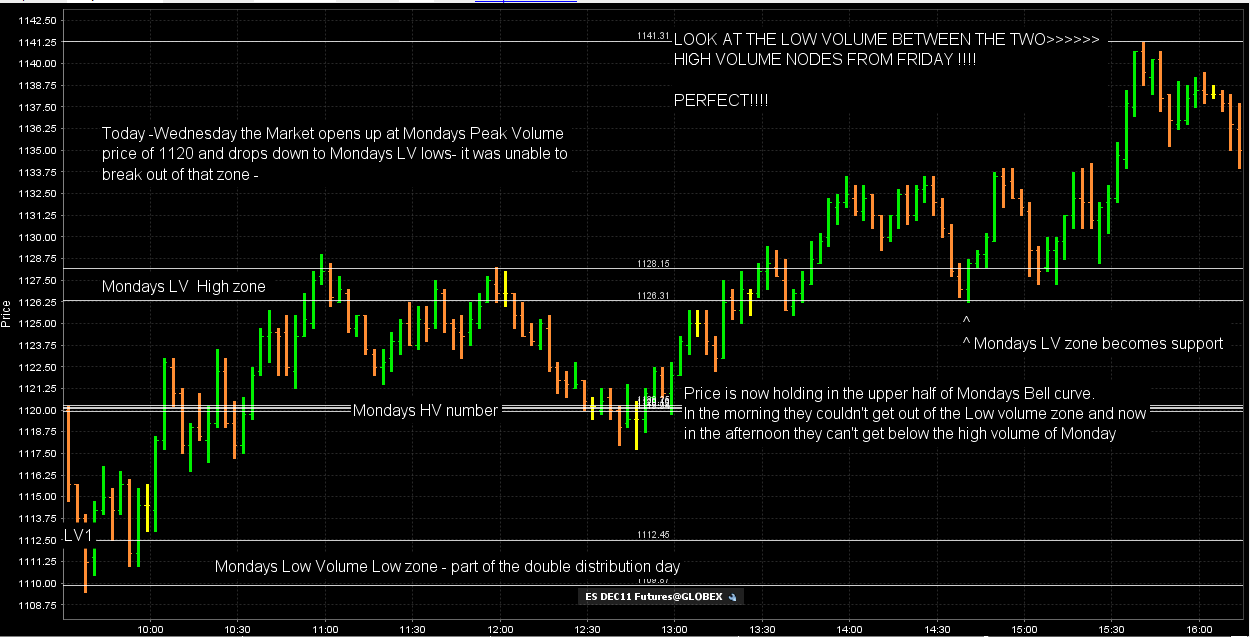
Beautiful run to our 60 area.....I always admire the market...even if I just sat here and did nothing.....have a great evening everyone..nice structure today ..once again we held above a previous days high volume price and continued higher....they did the same thing yesterday....very cool!!
I follow the 120 chart and its telling me that we could contin up I show no dev. yet
Increasing prices on Tues.,Wed.,Thursday on declining volume each day. Let's see if it holds.
Originally posted by sandoxe
NickP. You have some Qs about the fibs. in the chart posted last night. I will get back to you and post late afternoon.
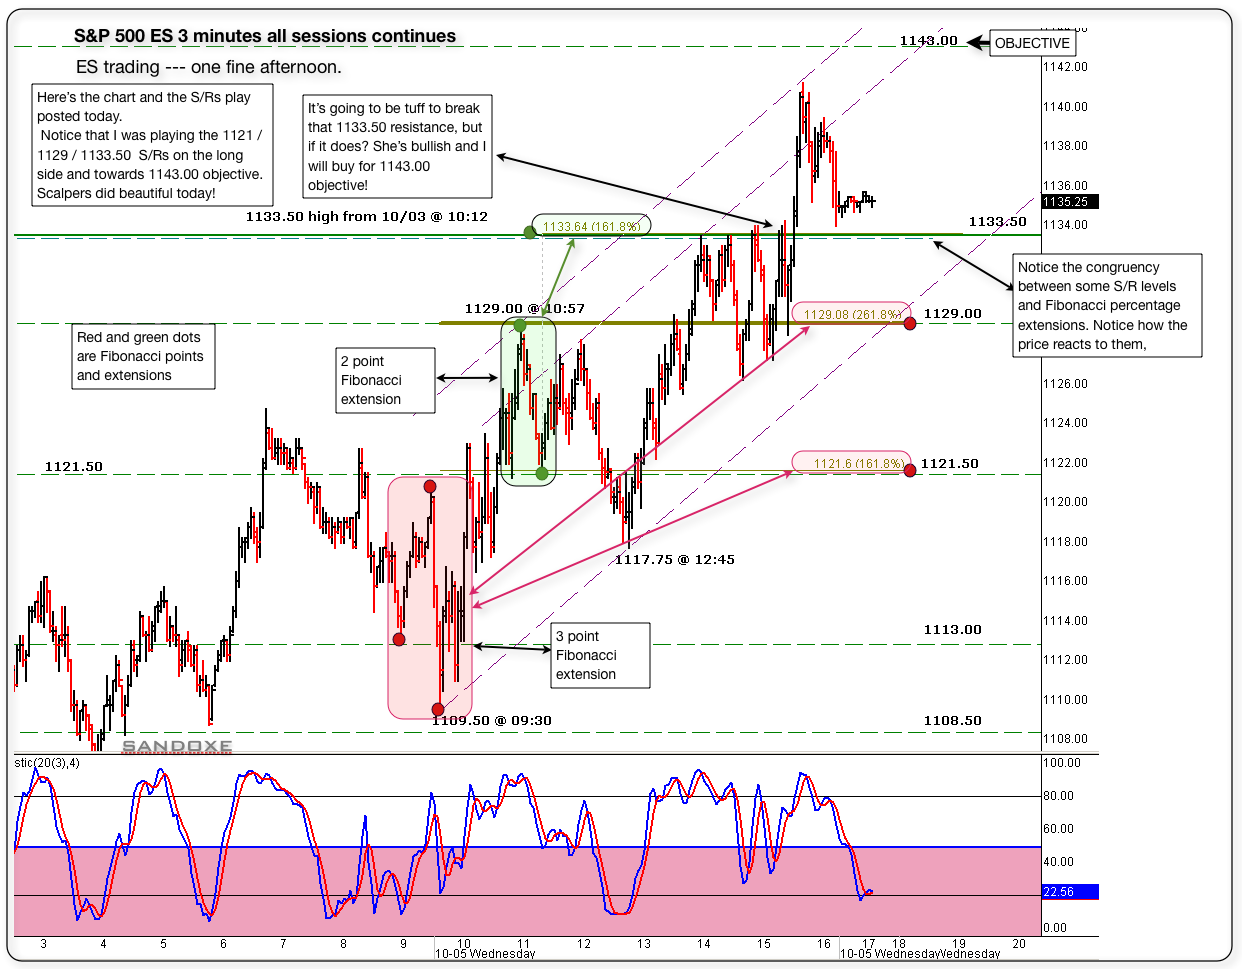
NickP. Here is the same 3 minutes chart posted yesterday afternoon. I took most of the labels off to show the Fibonacci extension tools and projections. Basically the chart is self explanatory.
I use Fib. ext. from any low or high. Basically what's important to me is the congruency between the extension and S/Rs. If you notice, in the chart you will see how the price reacts to those levels where Fibs. and S/Rs match.
Notice that yesterday I was buying from some of those levels. (up trend day)
Today I posted about buying from 1148.00 S/R level. Look what happen in the afternoon at 15:47, the price hit 1147.50 and rallied from there towards the 1163.00 objective posted this morning.
S/Rs and Fibs are places to keep an eye on, to possibly play from, in conjunction with your system's buy and sell signals.
I hope this helps in some way.-.
Click image for original size
thanks !
Originally posted by sandoxe
Originally posted by sandoxe
NickP. You have some Qs about the fibs. in the chart posted last night. I will get back to you and post late afternoon.
NickP. Here is the same 3 minutes chart posted yesterday afternoon. I took most of the labels off to show the Fibonacci extension tools and projections. Basically the chart is self explanatory.
I use Fib. ext. from any low or high. Basically what's important to me is the congruency between the extension and S/Rs. If you notice, in the chart you will see how the price reacts to those levels where Fibs. and S/Rs match.
Notice that yesterday I was buying from some of those levels. (up trend day)
Today I posted about buying from 1148.00 S/R level. Look what happen in the afternoon at 15:47, the price hit 1147.50 and rallied from there towards the 1163.00 objective posted this morning.
S/Rs and Fibs are places to keep an eye on, to possibly play from, in conjunction with your system's buy and sell signals.
I hope this helps in some way.-.
Click image for original size
Originally posted by NickP
thanks !
My pleasure NickP.
Emini Day Trading /
Daily Notes /
Forecast /
Economic Events /
Search /
Terms and Conditions /
Disclaimer /
Books /
Online Books /
Site Map /
Contact /
Privacy Policy /
Links /
About /
Day Trading Forum /
Investment Calculators /
Pivot Point Calculator /
Market Profile Generator /
Fibonacci Calculator /
Mailing List /
Advertise Here /
Articles /
Financial Terms /
Brokers /
Software /
Holidays /
Stock Split Calendar /
Mortgage Calculator /
Donate
Copyright © 2004-2023, MyPivots. All rights reserved.
Copyright © 2004-2023, MyPivots. All rights reserved.