ES Thursday 10-6-11
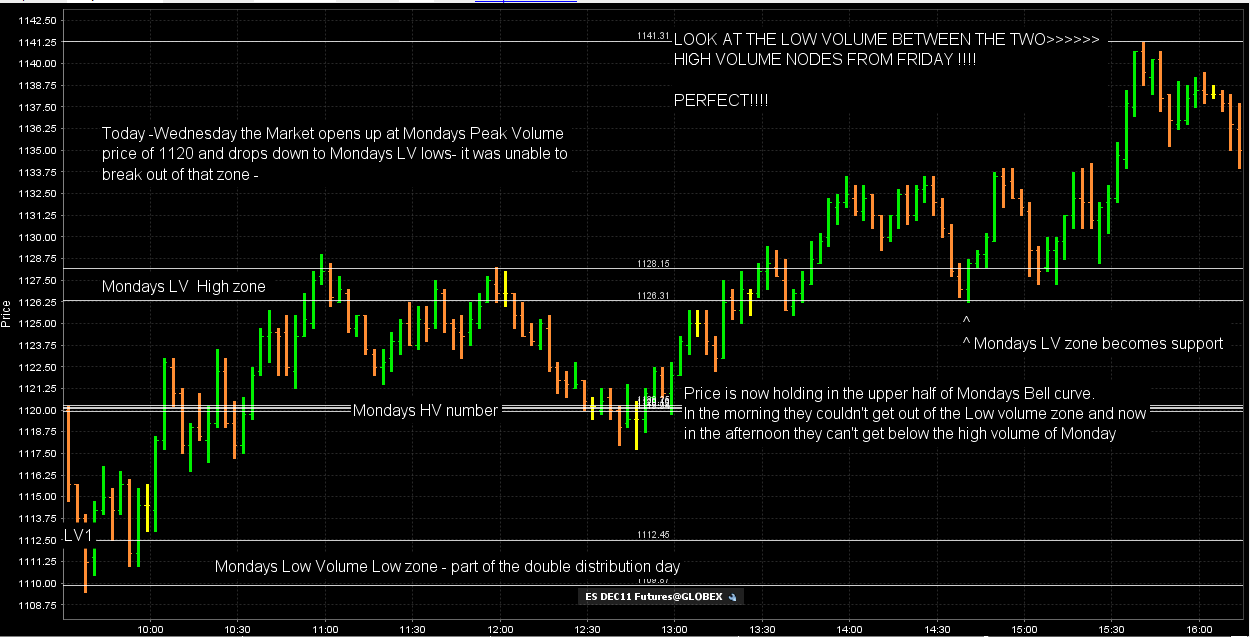
Here is a recap chart from Wednesday. I'm going to get the date right tonight. Very instructive day and was hoping we'd have some good examples this week. You may want to reference Mondays and Fridays chart to understand this a bit more as those "bell curves" interacted nicely with todays trade.
Click image for original size
Hey Bruce,
You've mentioned Monday and Fridays volume as key areas for Wednesdays trading. You most likely have gone over this before, so forgive me if I am repeating this aspect. How far do you go back and look at volume (high and low) for the current days trading? I have attached a photo of the charts I use showing on the left the volume profile since Monday and on the right Wednesdays profile. I have the sensitivity set at 10 prices. Is it better to simply visually see where the lows are or use a feature like this that inputs low and high volume nodes? (High volume in green lines, low volume in red lines).
On a side note, just for MP clarification and understanding. Was today a "trend day" as described by Dalton in "Mind Over Markets", (page 25, second paragraph down)?
Thanks!!
Sean
Click image for original size

Key numbers:
1134 - VAH and important S/R
1127 - Piv and lines up with market S/R so should be respected
1120 - Monday's high
1097-1110 LV and BO area, if market enters this zone, 1097 the BO area may be tested..
1104=3day rolling piv 1102.50 =LV
Above - 1141, 1144, 1145, 1149
1134 - VAH and important S/R
1127 - Piv and lines up with market S/R so should be respected
1120 - Monday's high
1097-1110 LV and BO area, if market enters this zone, 1097 the BO area may be tested..
1104=3day rolling piv 1102.50 =LV
Above - 1141, 1144, 1145, 1149
1124/1125=3day rolling piv high/Piv range low.. but is in between and close to 2 key levels 1120/1128, may get a reaction..
I show a single print from Oct. 4th at 1097.50 as well. One more confirmation if we head in that direction.
Originally posted by tradezilla
Key numbers:
1134 - VAH and important S/R
1127 - Piv and lines up with market S/R so should be respected
1120 - Monday's high
1097-1110 LV and BO area, if market enters this zone, 1097 the BO area may be tested..
1104=3day rolling piv 1102.50 =LV
Above - 1141, 1144, 1145, 1149
key low volume zone will be 45.5- -48.50
other low volume is
33.75
30.50
23.50
and our old pal 16.75....
now we need to see where we open...
most times the market will try to go to the closest low volume zone...so traders can TRADE...
other low volume is
33.75
30.50
23.50
and our old pal 16.75....
now we need to see where we open...
most times the market will try to go to the closest low volume zone...so traders can TRADE...
That is correct Sean...to your other questions:
I go back as far as I need to go and prefer to go day by day so I look at each days low and high volume spots...then zooming out like you are doing is good to find the major levels...
sometimes the smaller ones you willnot be as clear on the bigger charts but that is good for finding the major areas....basically confirm lower and higher time frames
Originally posted by Capitalista
I show a single print from Oct. 4th at 1097.50 as well. One more confirmation if we head in that direction.
Originally posted by tradezilla
Key numbers:
1134 - VAH and important S/R
1127 - Piv and lines up with market S/R so should be respected
1120 - Monday's high
1097-1110 LV and BO area, if market enters this zone, 1097 the BO area may be tested..
1104=3day rolling piv 1102.50 =LV
Above - 1141, 1144, 1145, 1149
My prefered trades are to buy into the 33.75 and/or the 31 if we trade down there first.....otherwise I'd prefer to sell into the extremes of last Fridays distribution up in the 45.50 and /or the 48.50 area.
Basically I will be waiting to see which low volume spot they will go for first in the day session and fade accordingly
Basically I will be waiting to see which low volume spot they will go for first in the day session and fade accordingly
I would not consider yesterday a trend day but I'd have to get my book out and look at his specific definition...we didnpt make higher highs all day on the 30 minute..and we spent lot of time consolidating
Bruce you realy dont trade before RTH??
I am today and light...I just got long...!!
Originally posted by NickP
thanks !
My pleasure NickP.
Emini Day Trading /
Daily Notes /
Forecast /
Economic Events /
Search /
Terms and Conditions /
Disclaimer /
Books /
Online Books /
Site Map /
Contact /
Privacy Policy /
Links /
About /
Day Trading Forum /
Investment Calculators /
Pivot Point Calculator /
Market Profile Generator /
Fibonacci Calculator /
Mailing List /
Advertise Here /
Articles /
Financial Terms /
Brokers /
Software /
Holidays /
Stock Split Calendar /
Mortgage Calculator /
Donate
Copyright © 2004-2023, MyPivots. All rights reserved.
Copyright © 2004-2023, MyPivots. All rights reserved.