ES Tuesday 12-6-11
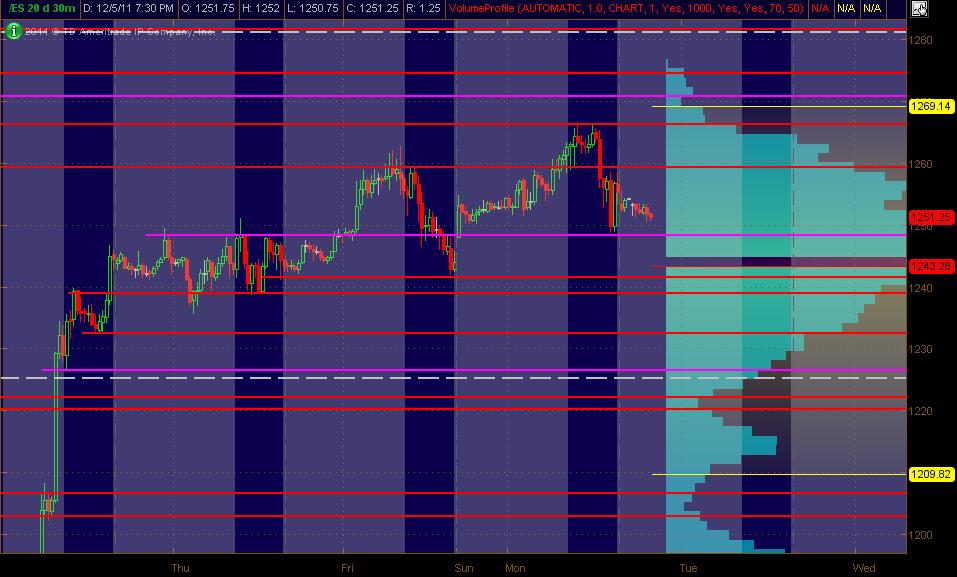
Here's what I've got for my ES MAP of PASR ZONES using a 30min chart of 20 days of data coming into Tuesday's trading. The Red lines are potential significant levels with Magenta lines as semi-significant. The White dashed lines are the Weekly Pivots. The Light Blue Volume Profile of the past "rolling" 20 days is displayed on the right vertical axis. The Gray background shows non-RTH price activity. Hope, as always, that this is helpful to some as a "MAP"
Near current ES price, I've got these as additional price level info:
1274-75 PASR / Daily R2 Pvt (based on RTH) / Fib Cluster
1260-61 PASR / 1 and 2 Day VolProf LVN (as per TOS platform)
1241-39 PASR signif "zone"
(obviously, some other levels are on the chart in between these to take notice of ... but these, to me, seem the most significant fwiw)
Click image for original size
Near current ES price, I've got these as additional price level info:
1274-75 PASR / Daily R2 Pvt (based on RTH) / Fib Cluster
1260-61 PASR / 1 and 2 Day VolProf LVN (as per TOS platform)
1241-39 PASR signif "zone"
(obviously, some other levels are on the chart in between these to take notice of ... but these, to me, seem the most significant fwiw)
INDU is about to close its last gap @12,230
if u did the 30 minute bar count you would have had about 15 - 17 thirty minute bars passing through the 56 area...and so far we had 11 thirty minute bars at the 63.75......the context help make that trade but it took two tries and it was agressive for this time of day when we are more likely to trend
Bruce are you counting from open of today
for this basic idea I am just looking at realtime hours for the past two days but even so if you look just at todays data you will see all that consolidation.....I'm only showing some conceptual ideas....we can get the same information following the volume histogram..
It takes volume on the vertical scale to drive and sustain price away from high volume made by a buildup of time...like this 56 area....when they can't sustain the drive away then we mean revert....it is a core priciple for my emini trading...hope that helps
It takes volume on the vertical scale to drive and sustain price away from high volume made by a buildup of time...like this 56 area....when they can't sustain the drive away then we mean revert....it is a core priciple for my emini trading...hope that helps
Thanks Bruce and all. Bruce, nice to have you back!
Emini Day Trading /
Daily Notes /
Forecast /
Economic Events /
Search /
Terms and Conditions /
Disclaimer /
Books /
Online Books /
Site Map /
Contact /
Privacy Policy /
Links /
About /
Day Trading Forum /
Investment Calculators /
Pivot Point Calculator /
Market Profile Generator /
Fibonacci Calculator /
Mailing List /
Advertise Here /
Articles /
Financial Terms /
Brokers /
Software /
Holidays /
Stock Split Calendar /
Mortgage Calculator /
Donate
Copyright © 2004-2023, MyPivots. All rights reserved.
Copyright © 2004-2023, MyPivots. All rights reserved.