ES Friday 1-6-12
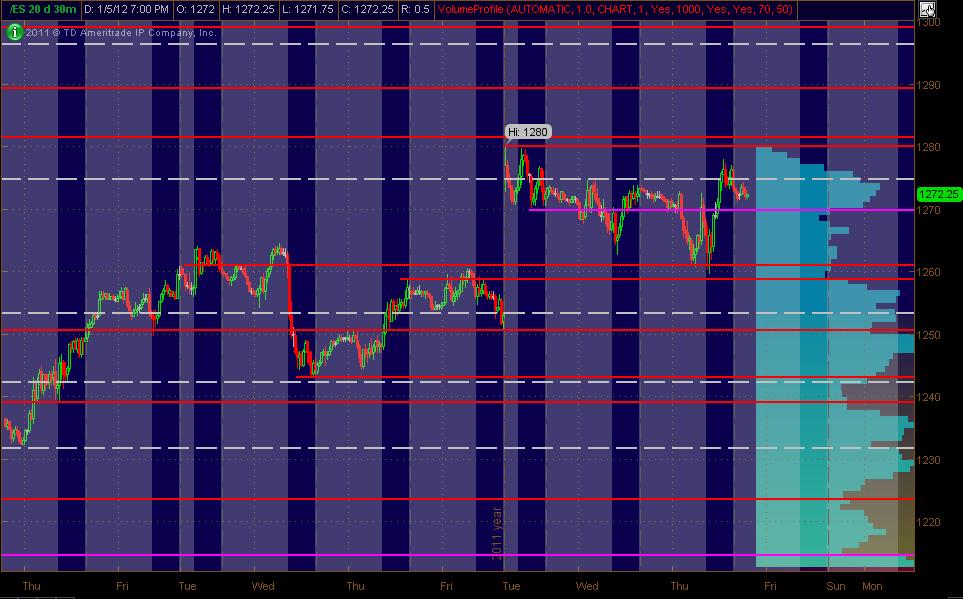
Here's what I've got for my ES MAP of PASR ZONES using a 30min chart of 20 days of data coming into Friday's trading. The Red lines are potential significant levels with Magenta lines as semi-significant. The White dashed lines are the Weekly Pivots. The Light Blue Volume Profile of the past "rolling" 20 days is displayed on the right vertical axis. The Gray background shows non-RTH price activity. Hope, as always, that this is helpful to some as a "MAP."
Btw, a couple of price lines are very near each other in price ... and should be considered ZONES between them.
Ps. (un)employment report comes out early in the morn' ... so thangs could be a bit whacky
Click image for original size
Btw, a couple of price lines are very near each other in price ... and should be considered ZONES between them.
Ps. (un)employment report comes out early in the morn' ... so thangs could be a bit whacky
bruce, why is it 70.5-71 the critical area for bears ? thx
Originally posted by BruceM
70.50 - 71 is now the price for bears to beat...if these prices hold then we will see the overnight highs ...all air is filled so I have no reason to be long or short...will wait until and hour high or low breaks out from here
VOlume
Click image for original size
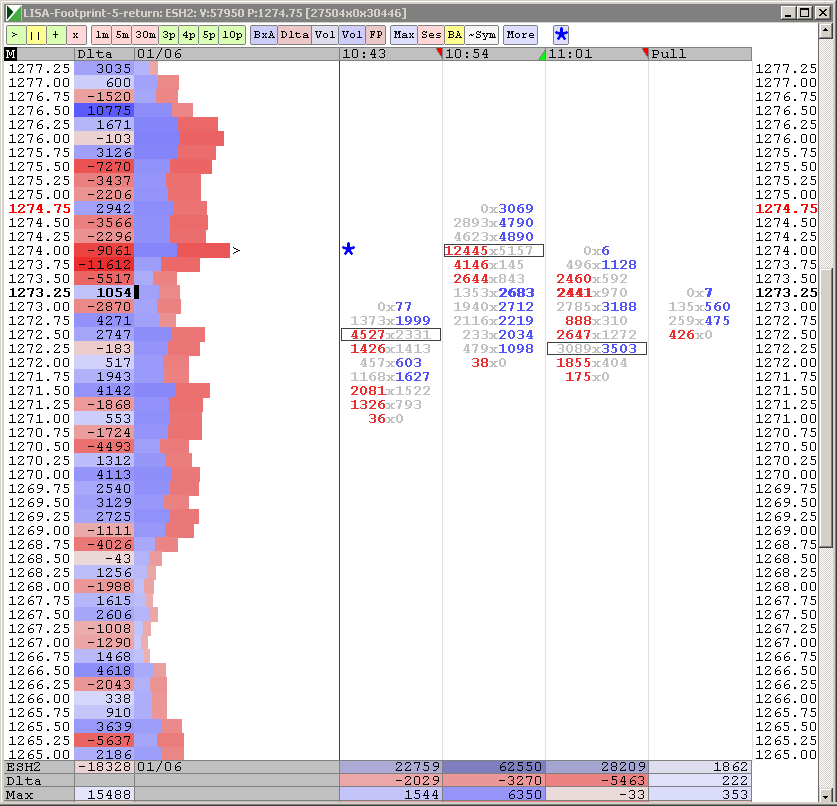
it's peak volume from the day session now Nick...at least it was when I wrote that...it moved up to 72.50....peak volume from O/N is 76.25 and that is yesterdays peak volume price too...forget to mention to watch out for that on upside...perfect hit on opening range low now
peak volume and vwap are equal so I'm anticipating a trade back to that now....no position on..of course holding above 76 will void that
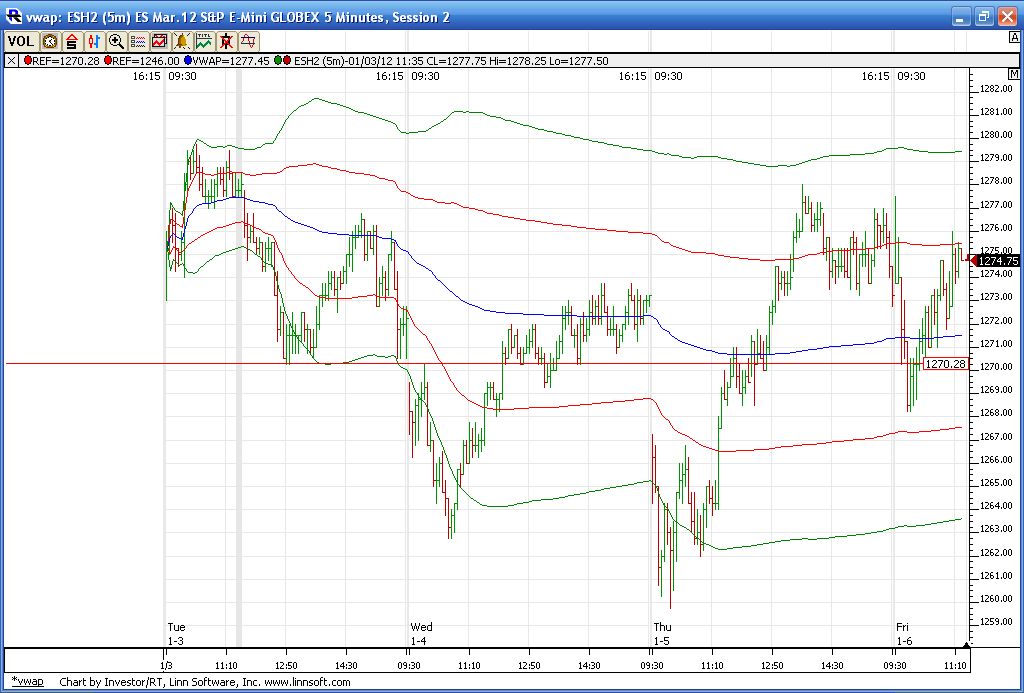
here is my weekly VWAP for fun...it should be noted that the peak volume price is also at 71 - 72 area for the week which still implies symetric trading
Click image for original size
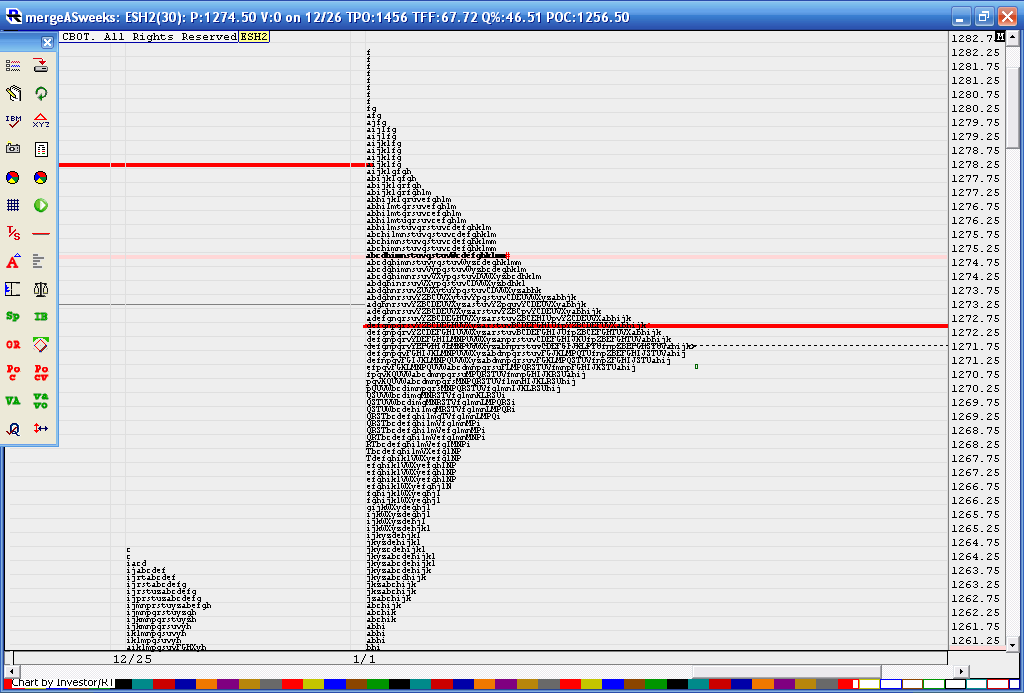
a look at all the consolidation and big bell curve this week due to all the consolidation. In theory this should mean a bigger move should develop from this. Hope all have a great weekend. This is just too boring now.
Click image for original size
have great weekend big man
bruce on your footprint you use 5 min or 30 min
Emini Day Trading /
Daily Notes /
Forecast /
Economic Events /
Search /
Terms and Conditions /
Disclaimer /
Books /
Online Books /
Site Map /
Contact /
Privacy Policy /
Links /
About /
Day Trading Forum /
Investment Calculators /
Pivot Point Calculator /
Market Profile Generator /
Fibonacci Calculator /
Mailing List /
Advertise Here /
Articles /
Financial Terms /
Brokers /
Software /
Holidays /
Stock Split Calendar /
Mortgage Calculator /
Donate
Copyright © 2004-2023, MyPivots. All rights reserved.
Copyright © 2004-2023, MyPivots. All rights reserved.