ES Wednesday 3-7-12
some videos, BLAST and my basic plan..good luck today
I know this is a late post as I was caught up in CL right b4 I meant to post but what I was going to post was this:
Today, the market was likely 2 sided but the better trade was to the long side even prior to this up move:
The reason was again the VOLD, which was trending up, though not smooth indicating bigger swings.
How I would use this information on a day like this was to prepare to take the LVN on the long side and pass on the LVN on the short side unless price moved significantly into a "strong" level for a fade.
In this case, I would not consider shorts till 54ish and would believe in this BO due to VOLD/ADD formation and vertical Volume.
s 49.75...gotta trade my numbers...
all higher risk as all is trying to break out..2 sets of air pockets below! this is plus 4 - 5.5 zone now but outside of the window of time
took the loss at 50.50...something is off and it's me ! will try again into 53 if it comes
trying again from 51.25..had to clear my head..
Click image for original size
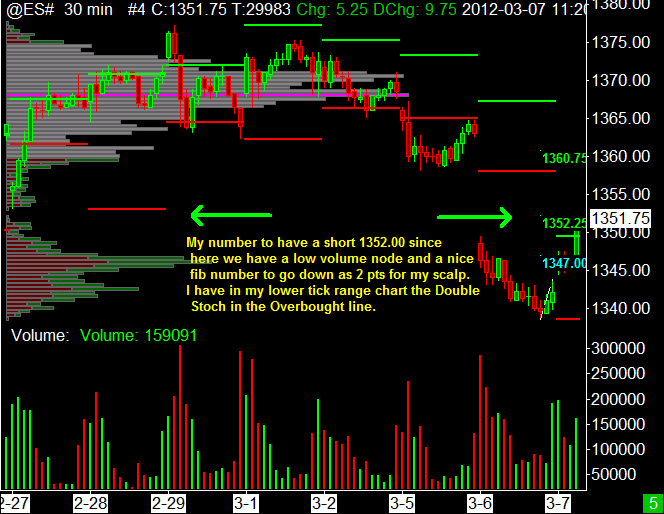
target is 49.50 and 48.50.
good question, on any move higher or lower, for that move to be technically strong, you want to see open interest increase. So on a huge day like yesterday, you'd want to see a jump higher in open interest to make it technically strong. basically yesterday was just liquidating, not new positions being initiated.
hope that makes sense. in effect, yesterday was bullish and most likely long liquidations, not longer term timeframe short initiations. As the market goes up and open interest increases, that means longer term timeframes are adding to long positions, which is bullish. longer term timeframes run the market, not us day traders.
refernce: series 3 testing materials and an old volume and open interest book, forgot the author off hand.
Originally posted by khamore1
I have started to watch the “open interest” which is something new for me. In the last 3 weeks it was going up 8-12k contacts per day.
Two days ago it went down 21k yesterday it went down another 23k contracts
What does it mean? As far as I know if the market will drop it will continue…
Anyone use , or has a different interpretation for this information please answer here
the challenge for me is that we know they have been having 10 -11 point ranges so if we add that to the lows we hit up against 55 - 56 at least. so fades are obviously agressive but we also don't ever know exactly how a range will unfold. we could catch the high and have it sell off into 1340 also - 42.
I'm assuming the high isn't here yet though
I'm assuming the high isn't here yet though
good area as that is basically the weekly value area high from the Feb. 6-Feb. 17.
Originally posted by johnpr2010
Click image for original size
Great input today folks. It is really appreciated.
Emini Day Trading /
Daily Notes /
Forecast /
Economic Events /
Search /
Terms and Conditions /
Disclaimer /
Books /
Online Books /
Site Map /
Contact /
Privacy Policy /
Links /
About /
Day Trading Forum /
Investment Calculators /
Pivot Point Calculator /
Market Profile Generator /
Fibonacci Calculator /
Mailing List /
Advertise Here /
Articles /
Financial Terms /
Brokers /
Software /
Holidays /
Stock Split Calendar /
Mortgage Calculator /
Donate
Copyright © 2004-2023, MyPivots. All rights reserved.
Copyright © 2004-2023, MyPivots. All rights reserved.