ES Monday 9-16-13
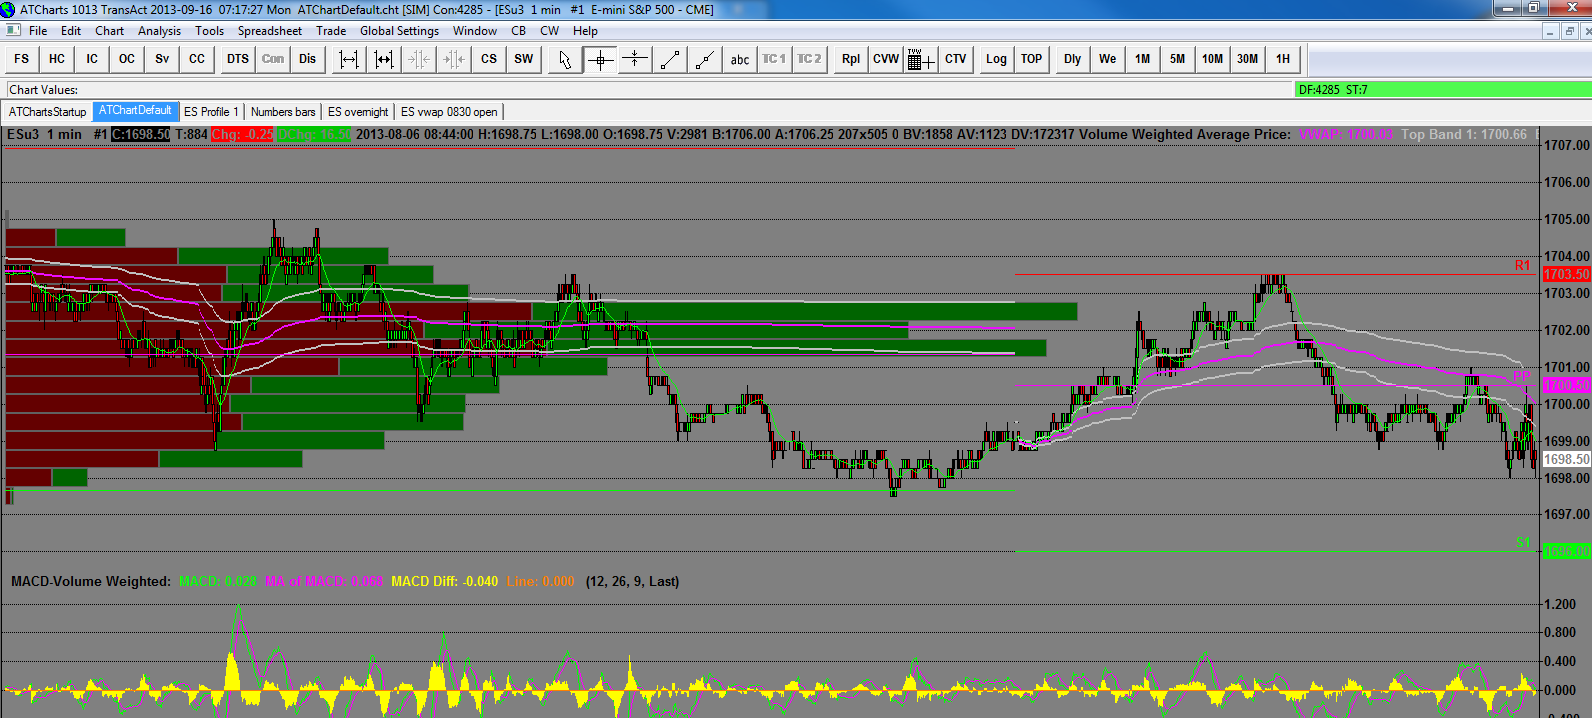
Big gap up over the weekend, back into record territory. The first chart is from August 5th and 6th, the last time we were at these levels. I didn't snap lines but you can see the high at 1705, the dip down to about 1697.50 and the retrace to 1703.50. After that the market started to fall off.
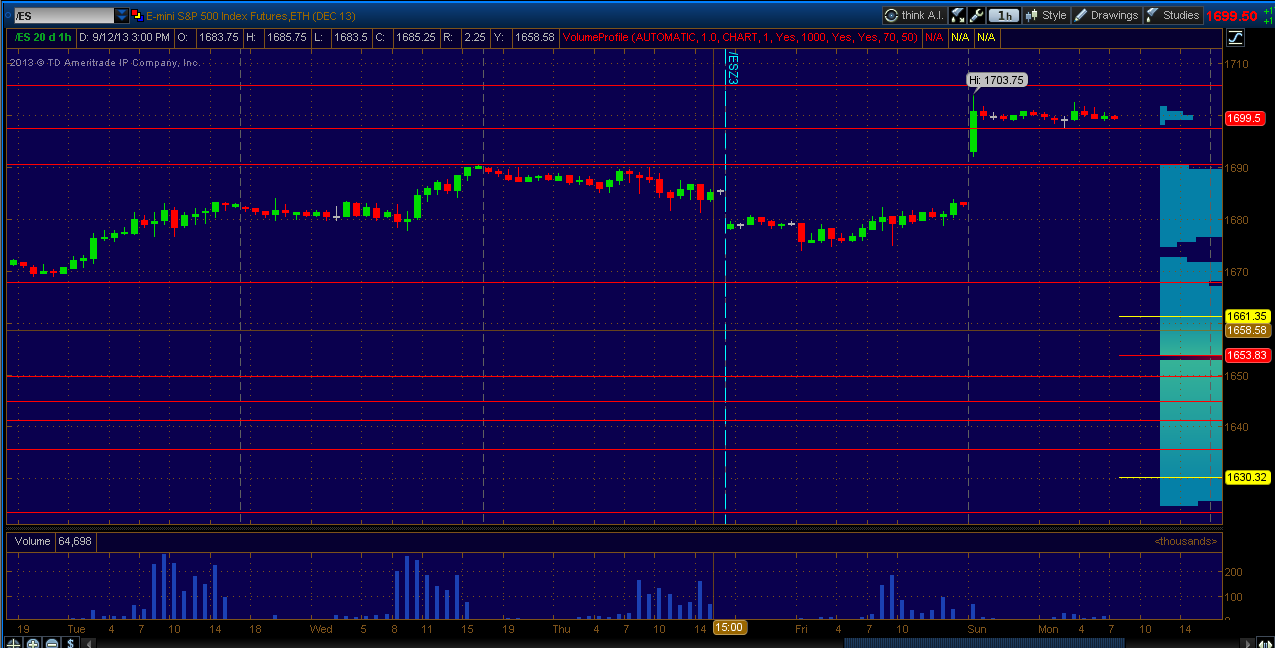
The second chart is current 60 minute. The lines only depict last weeks highs and the overnight support level which is also at 1697.50. Overnight markets are balanced and it's a long way back to fill the gap. Fed meetings this week to contend with also.
Click image for original size
The second chart is current 60 minute. The lines only depict last weeks highs and the overnight support level which is also at 1697.50. Overnight markets are balanced and it's a long way back to fill the gap. Fed meetings this week to contend with also.
Click image for original size
look at afternoon pullback low from 8-2 and 8-5 high.....sellers want to keep it under ..so I'm not staying long into that
done for today...anything I post from here on is just talk......
Nice trades today Bruce
no sure if this is "legal" but here is a pdf ...... article on page 9 from Gary Smith is very good...he is not a chartist and charts are only there for descriptive purposes.....these patterns still work....
thought some might find it an interesting and I have mentioned the concept of strength on Fridays before.....he has a few good patterns that have held up well
thought some might find it an interesting and I have mentioned the concept of strength on Fridays before.....he has a few good patterns that have held up well
Click link to access uploaded file:
April 2000 Issue.pdf
April 2000 Issue.pdf
thanks Bkay...I over posted and over videod today...I'm burned out from that and trading.....hopefully the videos and text can be put together and the concepts come through ...I would imagine it is very repititious to many here...and I'm too lazy to do spell check...
I'll read that article this afternoon, thanks
just watching now to see if they can test back of this downtrend....that would put them trying to get above 92 into the 92.75 volume...no test of this sell off yet this afternoon yet
Bruce...I figured out how to get that type of chart up... do you do it on just Real Time hours? or 24 hour chart? talking about the 30min vol profiles.
OK, I did figure out how to set up that 30min volume profile chart.... So what Is the best way to use this?
I understand it is showing me where the most volume is at certain prices. It is my understanding from watching you that ...these levels are then areas to be aware of for support and resistance areas?
thanks if you can lead me to some of your videos that explains this more.
I understand it is showing me where the most volume is at certain prices. It is my understanding from watching you that ...these levels are then areas to be aware of for support and resistance areas?
thanks if you can lead me to some of your videos that explains this more.
Emini Day Trading /
Daily Notes /
Forecast /
Economic Events /
Search /
Terms and Conditions /
Disclaimer /
Books /
Online Books /
Site Map /
Contact /
Privacy Policy /
Links /
About /
Day Trading Forum /
Investment Calculators /
Pivot Point Calculator /
Market Profile Generator /
Fibonacci Calculator /
Mailing List /
Advertise Here /
Articles /
Financial Terms /
Brokers /
Software /
Holidays /
Stock Split Calendar /
Mortgage Calculator /
Donate
Copyright © 2004-2023, MyPivots. All rights reserved.
Copyright © 2004-2023, MyPivots. All rights reserved.